Latest HUXt Forecast animation
This animation shows our latest forecast of the solar wind and solar eruptions (coronal mass ejections, CMEs). The presented view looks down on Earth’s orbital plane i.e. looking down on the north pole of the Sun. The forecast takes solar observations processed by the UK Met Office (UKMO), which are used as inputs to the University of Reading solar wind model HUXt.
Latest HUXt Forecast
Latest HUXt Forecast Animation
Latest HUXt Forecast
Latest HUXt Forecast Animation
Latest HUXt Forecast
Latest HUXt Forecast Animation
Latest HUXt Forecast
Latest HUXt Forecast Animation
Latest HUXt Forecast
Latest HUXt Forecast Animation
Latest HUXt Forecast
Latest HUXt Forecast Animation
Forecast Guide
The HUXt ensemble forecast takes two data inputs:
- UKMO estimates of the solar wind speed close to the Sun (at 21.5 rS). This comes from the WSA model driven with daily-updated magnetograms.
- UKMO estimates of CME properties (speed, direction, width) at 21.5 rS, from fitting the cone model to coronagraph observations
These are the two standard inputs to the WSA-Enlil solar wind model, which is used to produce the standard SWPC and UKMO forecasts. We perturb both inputs (solar wind and CME properties) within some reasonable ranges to generate large ensembles of different initial conditions at 21.5 rS. Each is propagated to Earth using HUXt, which is intended to capture the uncertainty in the forecast conditions at Earth.
Beschreibungen des Dashboard-Panels
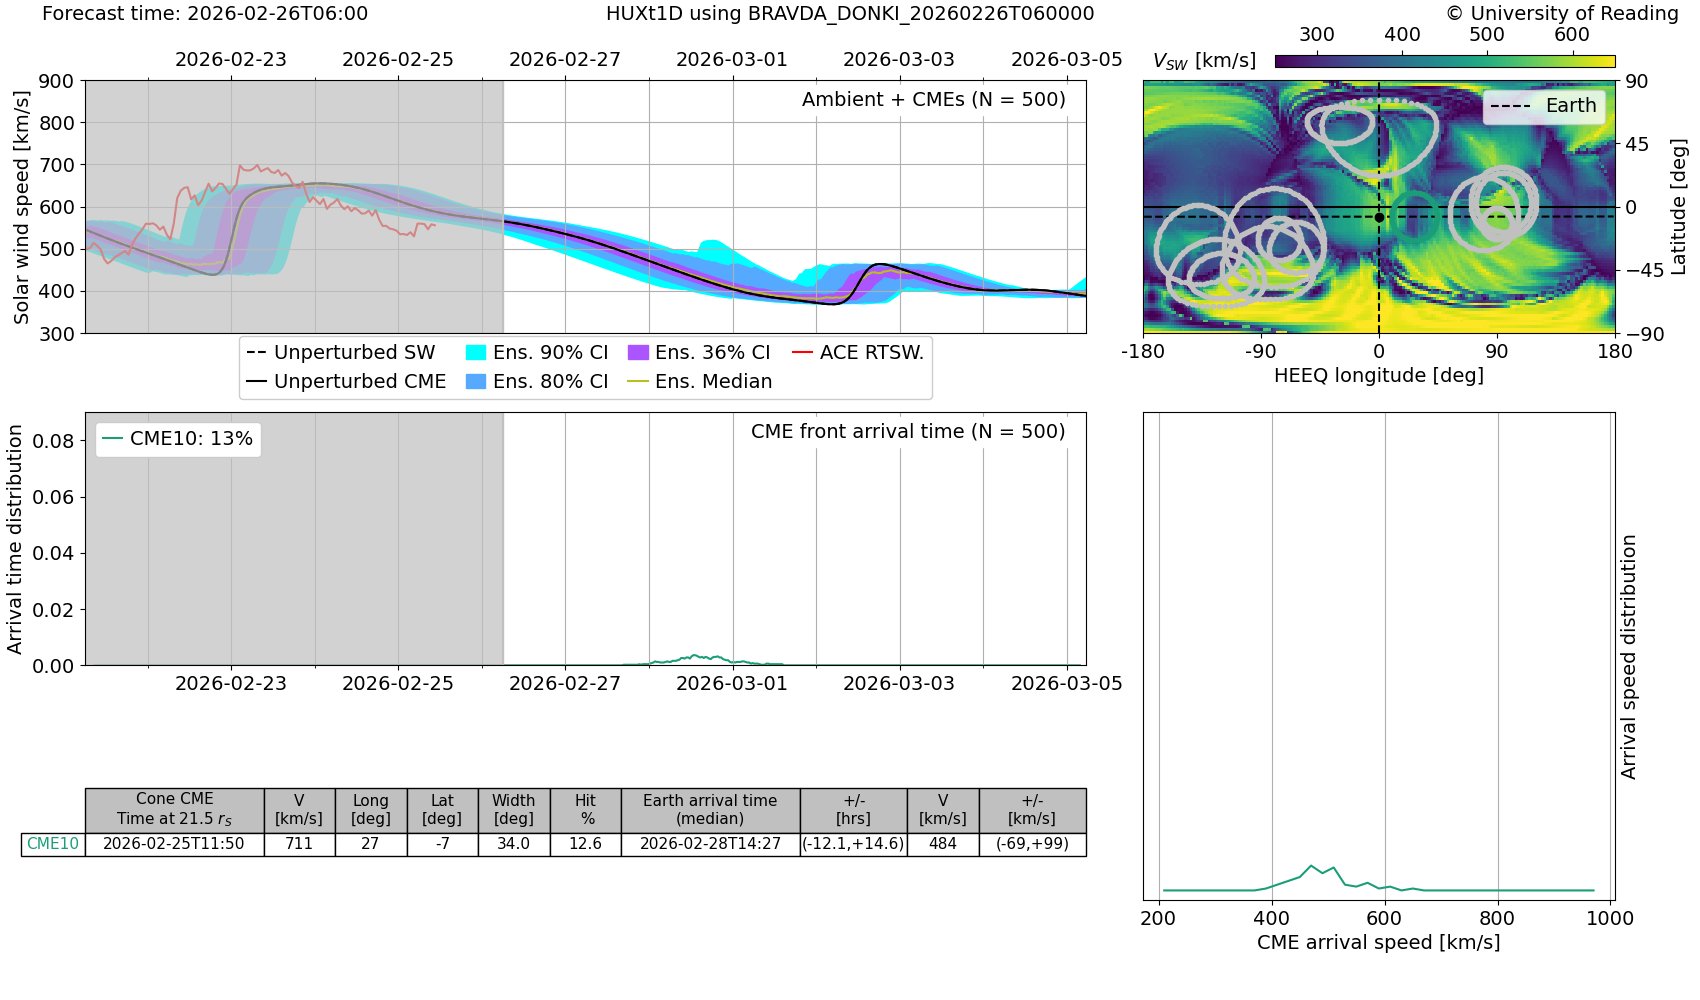
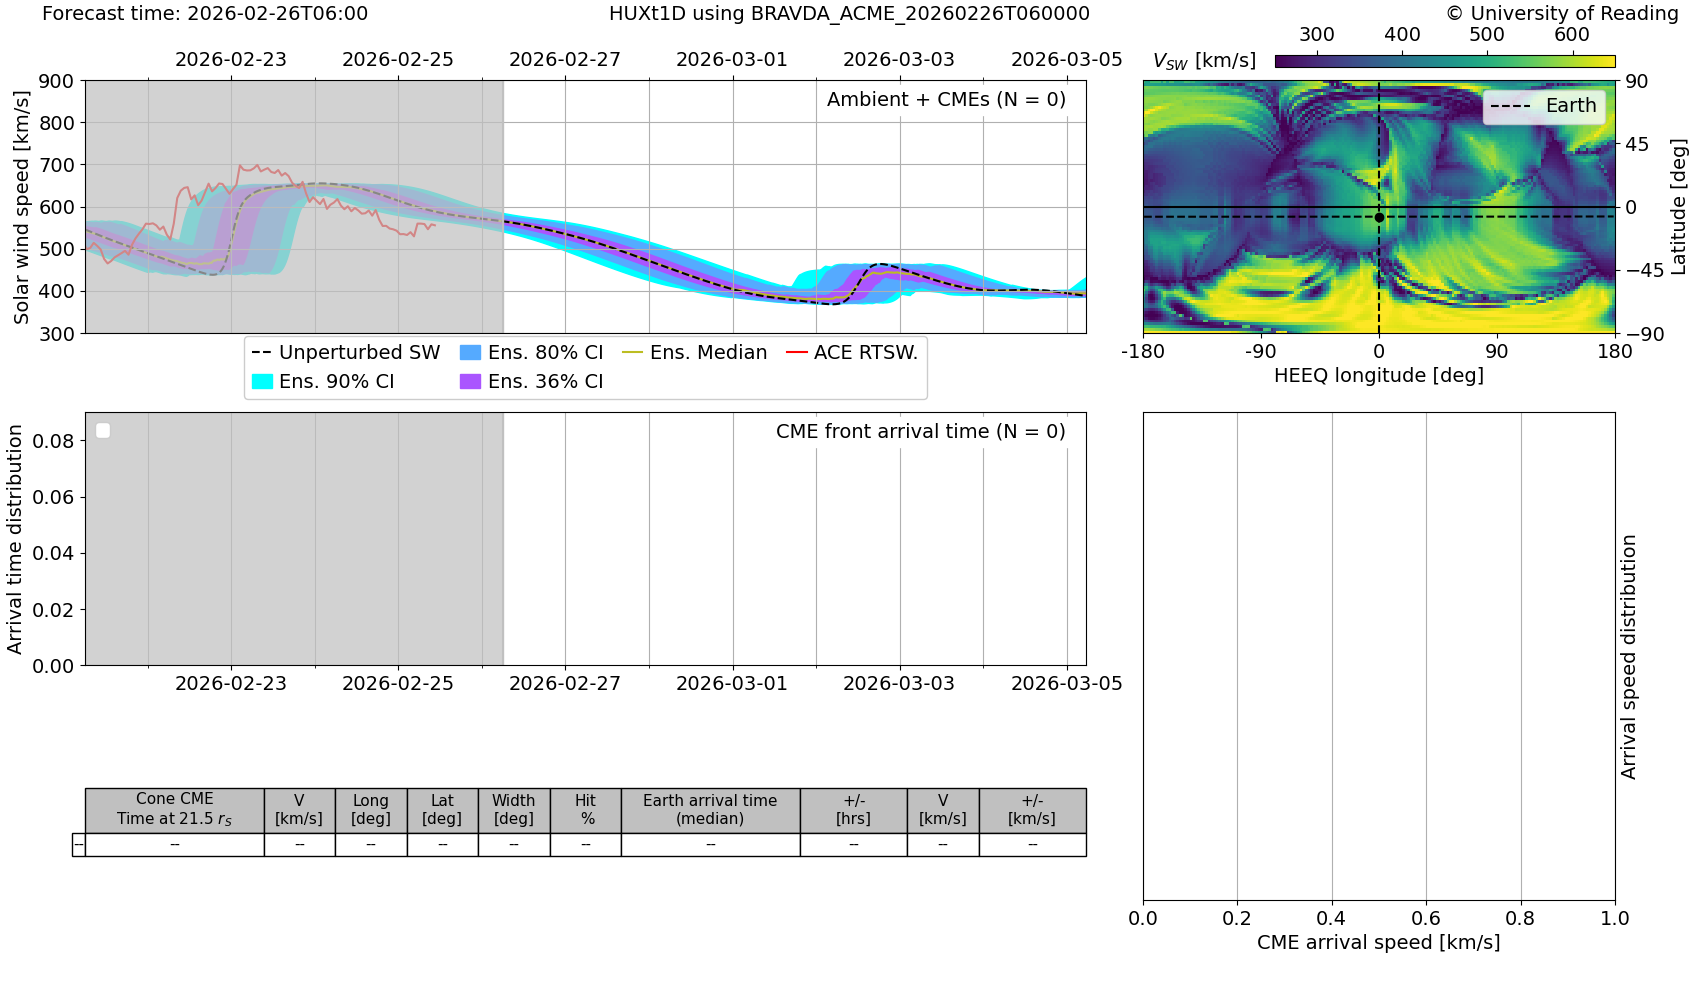
Oben links
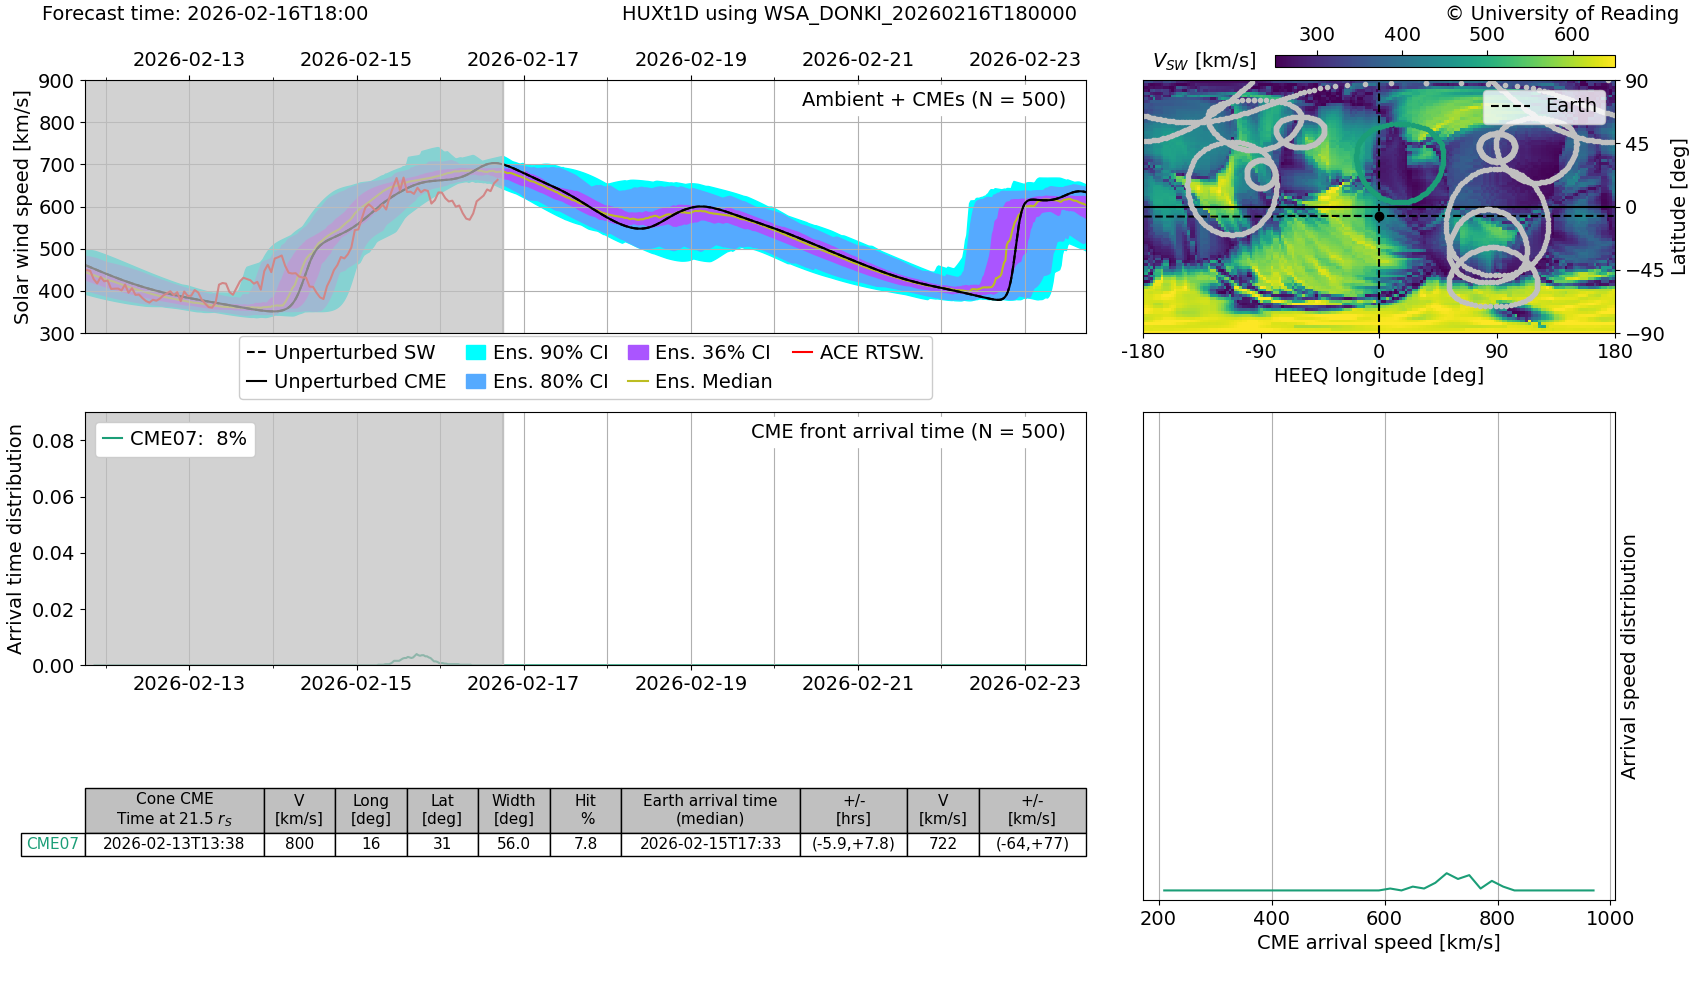
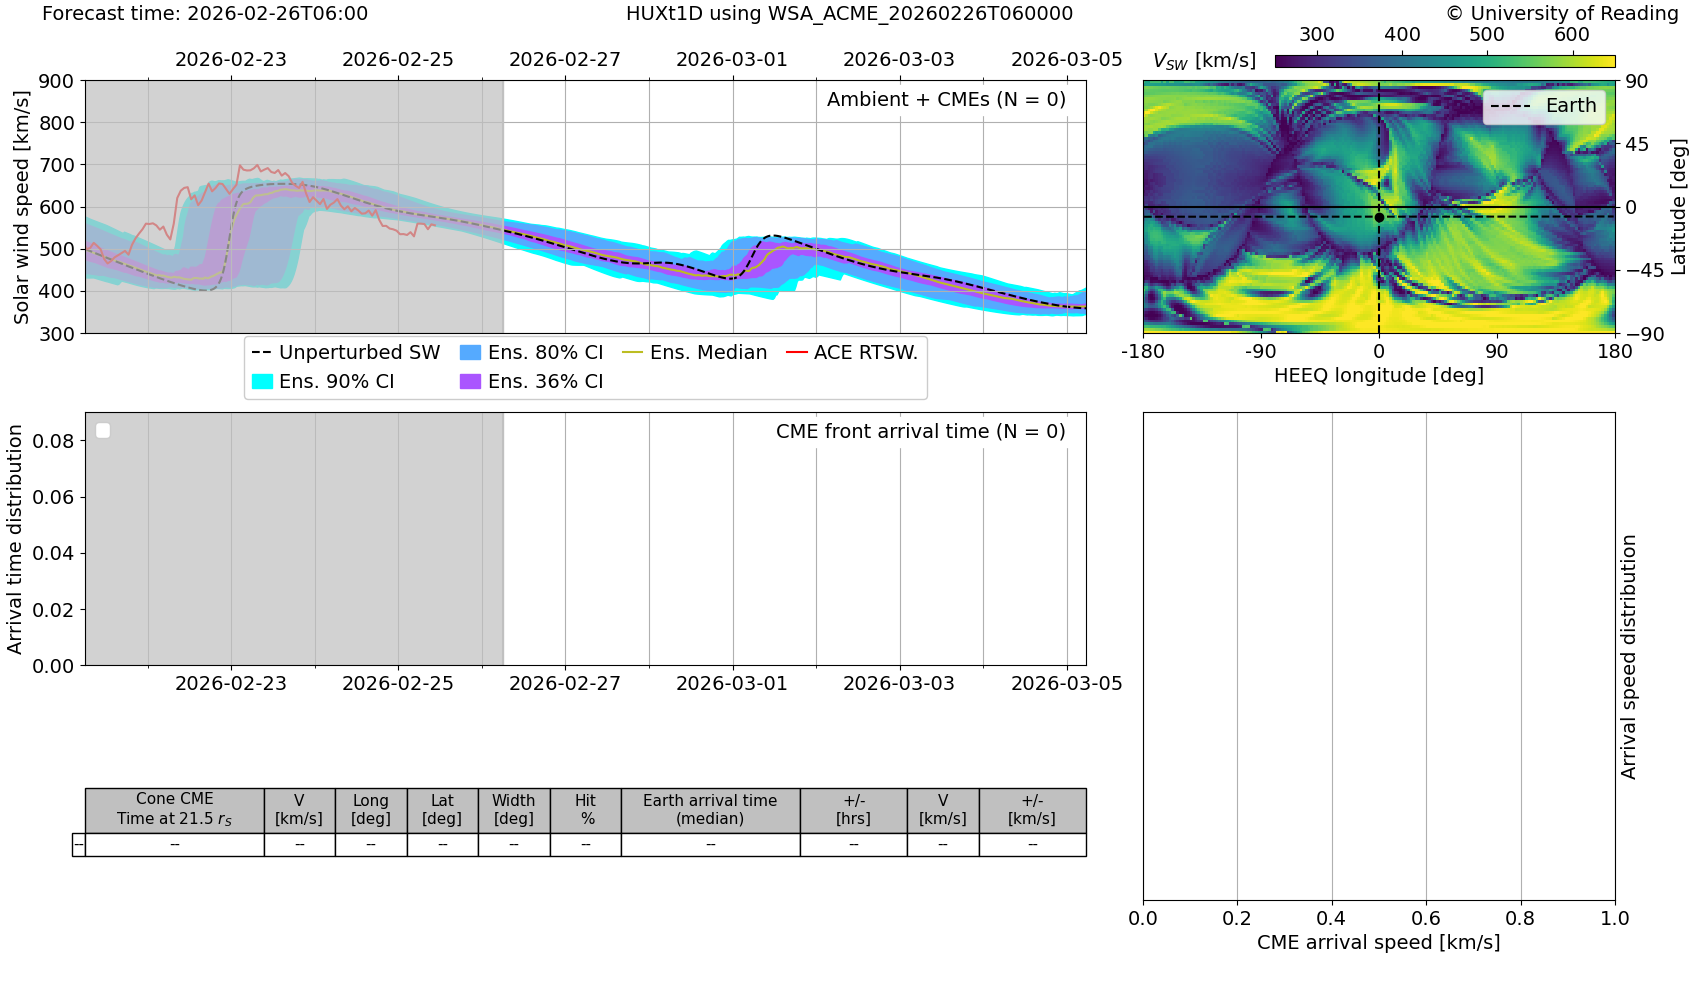
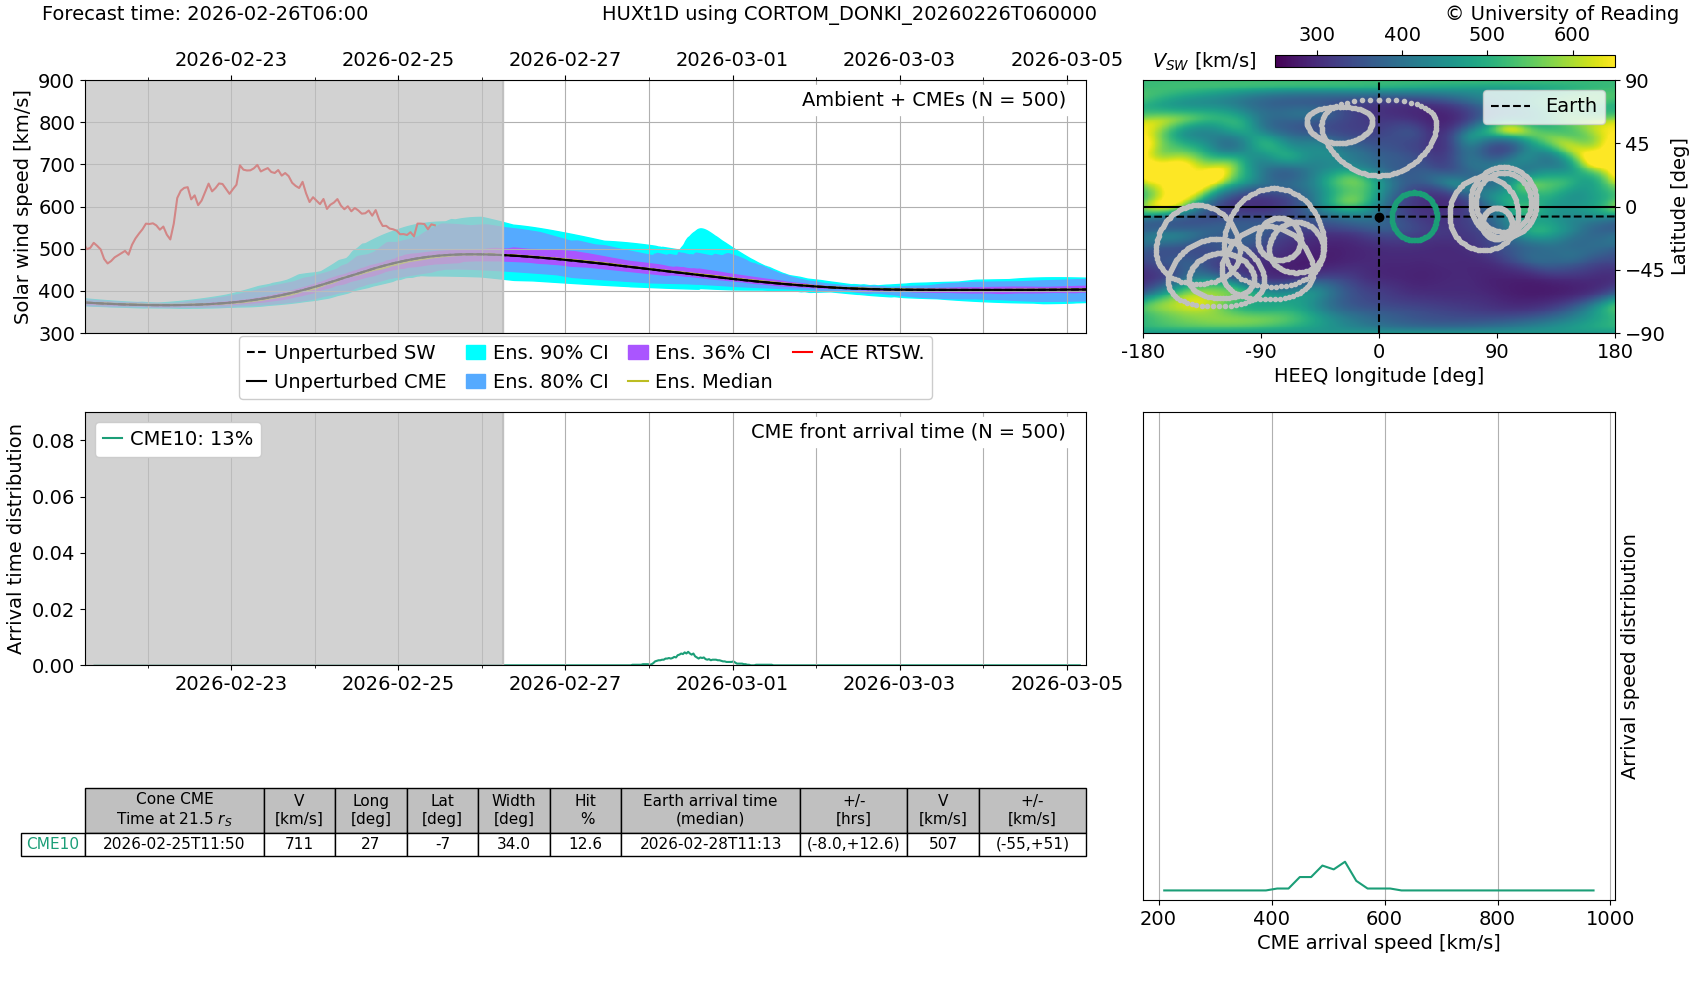
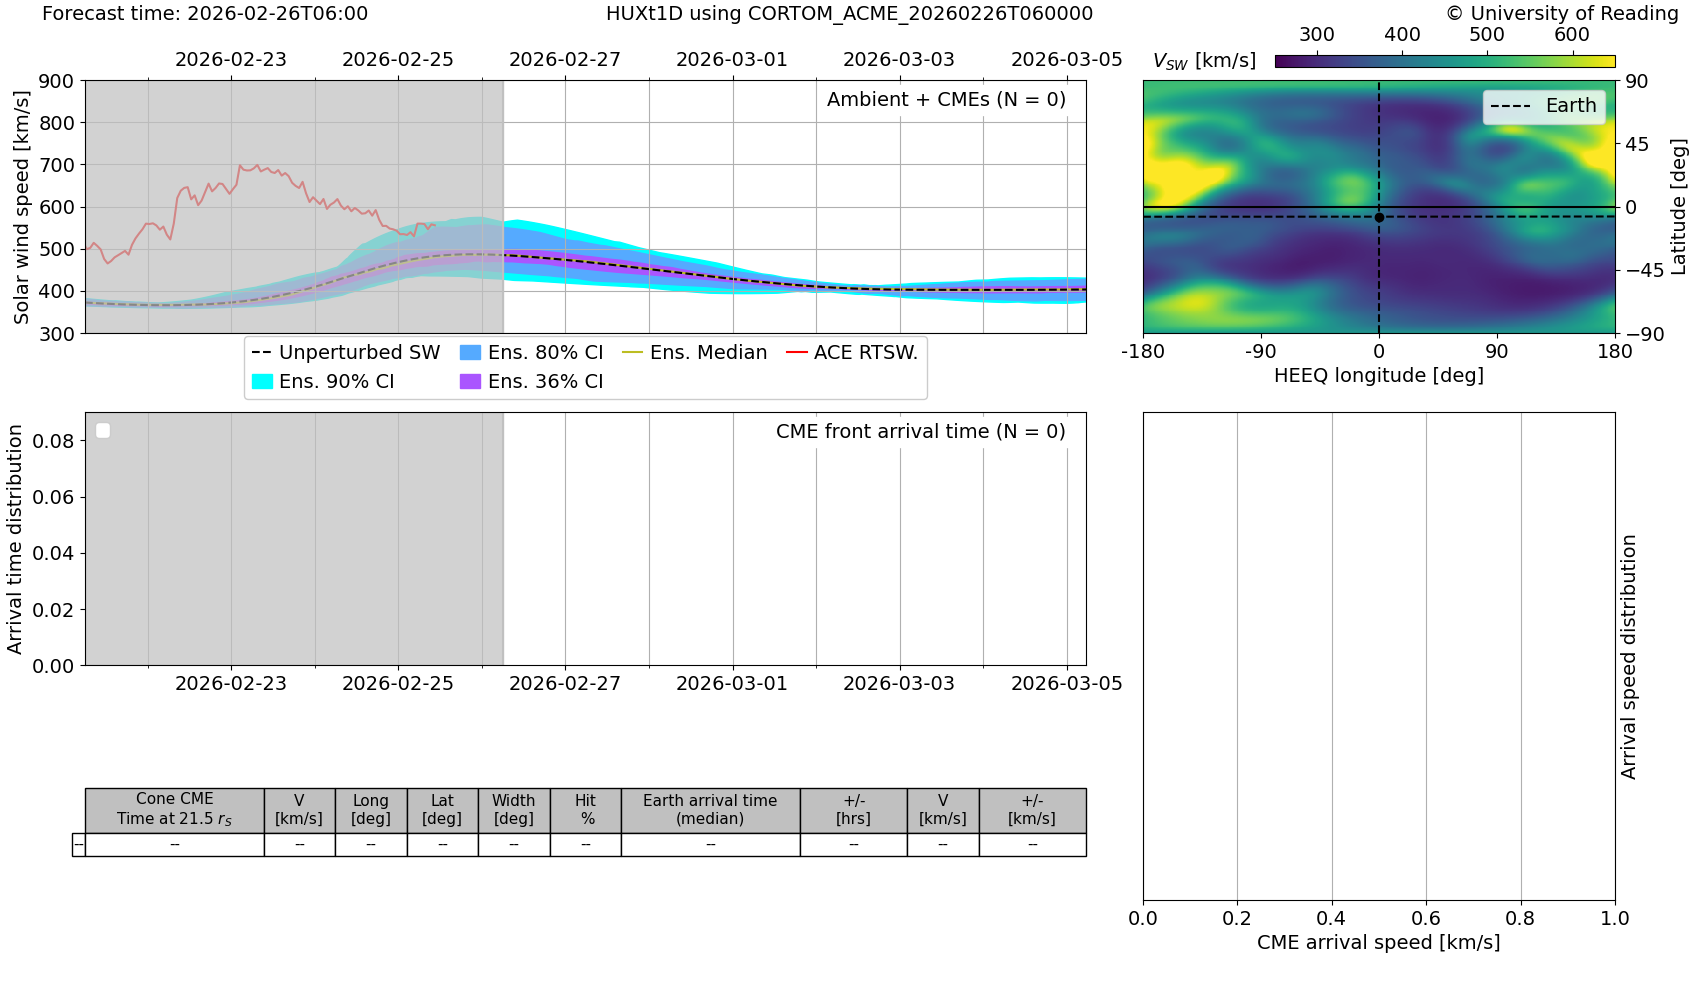
Zeitreihen der Sonnenwindgeschwindigkeit für die Anlaufphase des Modells (grau) und den Vorhersagezeitraum (weiß). Die schwarze Linie zeigt die „deterministische“ Vorhersage – ein HUXt-Lauf mit der WSA-Lösung und den CME-Parametern ohne Störungen. Diese Vorhersage sollte der Standard-WSA-Enlil-Vorhersage ähneln. Die weiße Linie stellt den Median des HUXt-Ensembles dar, die blauen/violetten Bänder die Perzentile des Ensembles. Schmale/breite Bänder weisen auf eine hohe/niedrige Vorhersagezuverlässigkeit hin. Die von DSCOVR gemessene Sonnenwindgeschwindigkeit in Echtzeit ist für die letzten 5 Tage rot dargestellt, diese Daten sind jedoch aufgrund von Problemen mit DSCOVR zunehmend unzuverlässig.
Mitte links
Time series of CME arrival probability at Earth. It's the fraction of ensemble members that predict a particular CME will arrival at Earth within a particular time window. The total area under a given curve is a measure of the confidence that CME will arrive at Earth. A narrow peak suggests a high confidence in the arrival time. A broader peak suggests low confidence in the arrival time.
Bottom-left
Table of the Earth-directed CME properties and forecast arrival times/speeds.
Top-right
Summary of the input data. The colour map shows the WSA solar wind speed at 21.5 rS in HEEQ coordinates. Overlaid are the positions and widths of CMEs identified by Met Office observers. Those with a possibility of Earth impact are assigned a colour used in other panels.
Bottom-right
The probability density of CME arrival speeds, for the Earth-impacting CMEs only. The total area under the curve is a measure of the confidence a CME will arrive at Earth. A narrow/broad peak suggests a high/low confidence in the arrival speed.
Neueste Nachrichten
X1.1 solar flare, G2 watch
G3 geomagnetic storm watch for 4 and 5 June
Coronal hole faces Earth
Neue Nachrichten im Forum
Unterstützen Sie SpaceWeatherLive!
Viele Menschen nutzen SpaceWeatherLive, um die Sonnenaktivität zu verfolgen oder um zu schauen, ob es eine Chance gibt Polarlichter, zu sehen. Mit zunehmendem Datenverkehr steigen jedoch die Kosten für die Serververfügbarkeit. Wenn Ihnen SpaceWeatherLive gefällt und Sie das Projekt unterstützen möchten, können Sie ein Abonnement für eine werbefreie Website abschließen oder eine Spende tätigen. Mit Ihrer Hilfe können wir SpaceWeatherLive online halten!


Weltraumwetter-Fakten
| Letzte Klasse X-Eruption | 04/07/2026 | X1.3 |
| Letzte Klasse M-Eruption | 20/07/2026 | M3.4 |
| Letzter geomagnetischer Sturm | 04/07/2026 | Kp7+ (G3) |
| Tage ohne Flecken | |
|---|---|
| Letzte 365 Tage | 3 Tage |
| 2026 | 3 Tage (1%) |
| Letzter fleckenlose Tag | 24/02/2026 |
| Monatliche mittlere Sonnenfleckenzahl | |
|---|---|
| Juni 2026 | 94.4 -7.1 |
| Juli 2026 | 70.7 -23.7 |
| Letzte 30 Tage | 85.8 -20.7 |