Vaata pühapäev, 8 detsember 2013 arhiivi
SIDC igapäevane bülletään päikese ja geomagnetilise aktiivsuse kohta
Välja antud: 2013 Dec 08 1250 UTC
SIDC ennustus
Päikesepursked ehk loited
Eruptive (C-class flares expected, probability >=50%)
Geomagnetism
Active conditions expected (A>=20 or K=4)
Päikese prootonid
Quiet
| 10 cm vool | Ap | |
|---|---|---|
| 08 Dec 2013 | 157 | 024 |
| 09 Dec 2013 | 157 | 008 |
| 10 Dec 2013 | 157 | 014 |
Bülletään
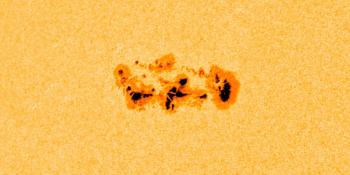
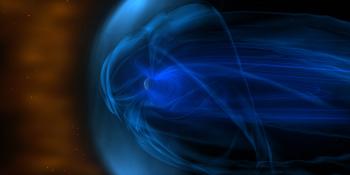
The X-ray curve is situated near the top/bottom of the B/C-level. C-flares are very likely, the probability for M-flares is around 20%. The December 7 M1.2 flare (07:29UT peak time) from NOAA AR 1909 was associated with a CME. CACTus determined it as a (partial) halo CME with a speed around 900 km/s. The bulk of the plasma is ejected under the ecliptic plane. The side of the CME may impact the Earth. This glancing blow can possibly arrive late December 9, early December 10 and may result in geomagnetic disturbances. Late December 7, a co-rotating interaction region (CIR) arrived. The density increased gradually together with the magnetic field. The z-component fluctuated strongly, even to -25nT which resulted in a planetary K of 6 and 5 and local K Dourbes of 5 and 4 early December 8. Following the density increase and slow decrease, the solar wind speed increased gradually. The CIR and fast solar wind is possibly linked with the coronal hole which reached the central meridian on December 3. A shock is visible on ACE data on December 8, 7:30UT: the solar wind speed increased from 500 km/s to around 650 km/s, the temperature, density and magnetic field dropped. This fast reverse shock is possibly linked with the filament eruption of December 5. The geomagnetic impact will be limited and smaller compared to the CIR because of the drop in magnetic field strength. Bz rotated from negative (-5nT
Päikese indeksid 07 Dec 2013
| Catania Wolfi number | /// |
| 10cm päikesevoog | 157 |
| AK Chambon La Forêt | 026 |
| AK Wingst | 008 |
| Hinnanguline Ap | 007 |
| Hinnanguline rahvusvaheline päikeselaikude arv | 062 - Põhineb 14 jaamal |
Märkimisväärsete sündmuste kokkuvõte
| Päev | Algus | Maks | Lõpp | Lokatsioon | Tugevus | OP | 10cm | Catania/NOAA | Raadiosignaalipursete tüübid | |
|---|---|---|---|---|---|---|---|---|---|---|
| Puuduvad | ||||||||||
Andmed on esitanud Päikeseinfektide Andmeanalüüsi Keskus (Solar Influences Data Analysis Center)© - SIDC - Töötleb SpaceWeatherLive
Kõik ajad UTC-s
<< Mine igapäevase ülevaate lehele
Viimane uudis
Complex sunspot region 4366
CME impact! S4 solar radiation storm

X1.9 solar flare with earth-directed CME
Viimane foorumi postitus
Toeta SpaceWeatherLive.com-i!
Paljud inimesed tulevad SpaceWeatherLive veebilehele jälgima päikese aktiivsust või kui on võimalus näha virmalisi. Kuid suurema võrguliiklusega kaasnevad ka serverite suuremad võrgus hoidmise kulud. Kui teile meeldib SpaceWeatherLive ja soovite projekti toetada, saate valida reklaamivaba tellimuse või kaaluda annetamist. Teie abiga saame SpaceWeatherLive'i võrgus hoida!


Fakte kosmose ilmast
| Viimane X-loide | 04/02/2026 | X4.3 |
| Viimane M-loide | 12/02/2026 | M1.4 |
| Viimane geomagnetiline torm | 05/02/2026 | Kp5+ (G1) |
| Plekivabasid päevi | |
|---|---|
| Viimane päikese plekivaba päev | 08/06/2022 |
| Kuu keskmine päikeseplekkide arv | |
|---|---|
| jaanuar 2026 | 112.6 -11.4 |
| veebruar 2026 | 125.3 +12.7 |
| Viimased 30 päeva | 130.4 +32.7 |