Affichage des archives de lundi, 20 février 2023
Bulletin quotidien sur l'activité solaire et géomagnétique du SIDC
Publié: 2023 Feb 20 1259 UTC
Prévisions SIDC
Éruptions solaires
M-class flares expected (probability >=50%)
Géomagnétisme
Minor storm expected (A>=30 or K=5)
Moniteur de Flux de Proton
Quiet
| Flux de 10 cm | Ap | |
|---|---|---|
| 20 Feb 2023 | 169 | 025 |
| 21 Feb 2023 | 168 | 032 |
| 22 Feb 2023 | 169 | 017 |
Bulletin
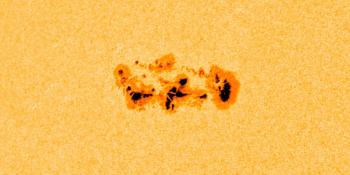
Several C class flares occurred over the period. The strongest one was from Catania group 84 (NOAA active region 3226) peaking at C7.1 level at 7:02UTC. But also Catania group 89 (NOAA active region 3229) created a C4.7 flare. Most frequent flaring was from a new emerging region in the north-west. Catania group 91 (NOAA active region 3231) produced 3 C flares, of which a C5.5 flare peaking at 6:08UTC. Apart from the new emerging Catania group 91, most regions seemed to stabilise. Decay in the trailing spots of Catania group 84 (NOAA active region 3226) was observed. Despite some consolidation, Catania group 89 (NOAA active region 3229) continues to show mixed polarity areas. M flares are quite likely with also a chance for another X flare. Especially from Catania group 89 (NOAA active region 3229).
Around 16:00UTC a filament eruption is seen in SDO/AIA 304 images from the south-western quadrant. An associated CME is also visible in coronagraph images. It is judged to be too narrow and too far off the Sun-Earth line to be of influence to Earth.
The greater than 10 MeV proton flux was at nominal levels in the past 24 hours. There is a small chance of a proton event exceeding the 10pfu threshold, due to possible further high-level flares. The greater than 2 MeV electron flux was below the 1000 pfu threshold and is expected to remain below this threshold over the next days. The 24h electron fluence was at normal levels and is expected to be at normal levels over the next 24 hours.
Solar wind conditions initially continued the decreasing trend. At 9:52UTC a shock was observed in the solar wind with speed jumping suddenly from 370 km/s to 410 km/s and total magnetic field from 6nT to 14nT. This shock is most likely associated to the halo CME from 20:38UTC, February 17 following the X2 flare that peaked at 20:16UTC. The CME was mainly directed towards the North East and we are expecting to only see a glancing blow. The north-south component of the interplanetary magnetic field is currently directed northward. The effects of the glancing blow will likely fade into the expected high speed stream from the equatorial positive polarity coronal hole that crossed the central meridian on February 17.
The geomagnetic conditions were at quiet to unsettled levels over the past 24 hours (local K-Bel and NOAA Kp 1-3). Active to minor storm conditions are possible in the next 24 hours associated with the CME glancing blow. Later active conditions may still be reached under the expected high speed stream solar wind conditions.
Estimation du nombre international de taches solaires (ISN) pour aujourd'hui : 127, sur la base de 11 stations.Indices solaires pour 19 Feb 2023
| Nombre de Wolf, observé par Catania | /// |
| Flux solaire à 10 cm | 169 |
| AK Chambon La Forêt | 007 |
| AK Wingst | 008 |
| Ap estimé | 008 |
| Nombre international de taches solaires estimé | 117 - Basé sur 17 stations |
Résumé des événements marquants
| Jour | Commencer | Max | Fin | Loc | Force | OP | 10cm | Catania/NOAA | Types de sursaut radio | |
|---|---|---|---|---|---|---|---|---|---|---|
| Aucun | ||||||||||
Données fournies par le Solar Influences Data analysis Center© - SIDC - Traité par SpaceWeatherLive
Toutes les heures sont indiquées en UTC
Dernières nouvelles

M2.7 solar flare, CME arrival possible
Complex sunspot region 4366

CME impact! S4 solar radiation storm
Forum
Aidez SpaceWeatherLive.com !
De nombreuses personnes consultent SpaceWeatherLive pour suivre l'activité solaire ou observer les aurores boréales, mais l'augmentation du trafic engendre des coûts plus élevés pour maintenir les serveurs en ligne. Si vous appréciez SpaceWeatherLive et souhaitez soutenir le projet, vous pouvez vous abonner pour un site sans publicité ou faire un don. Grâce à votre aide, SpaceWeatherLive restera accessible !


La Météo Spatiale en faits
| Dernière classe X | 04/02/2026 | X4.21 |
| Dernière classe M | 26/03/2026 | M4.0 |
| Dernier orage géomagnétique | 25/03/2026 | Kp5+ (G1) |
| Jours sans taches solaires | |
|---|---|
| 365 derniers jours | 3 jours |
| 2026 | 3 jours (4%) |
| Dernier jour sans taches solaires | 24/02/2026 |
| Nombre mensuel moyen de taches solaires | |
|---|---|
| février 2026 | 78.2 -34.3 |
| mars 2026 | 80.2 +2 |
| 30 derniers jours | 78.8 -2 |