Affichage des archives de mardi, 26 mars 2024
Bulletin quotidien sur l'activité solaire et géomagnétique du SIDC
Publié: 2024 Mar 26 1233 UTC
Prévisions SIDC
Éruptions solaires
M-class flares expected (probability >=50%)
Géomagnétisme
Active conditions expected (A>=20 or K=4)
Moniteur de Flux de Proton
Quiet
| Flux de 10 cm | Ap | |
|---|---|---|
| 26 Mar 2024 | 186 | 017 |
| 27 Mar 2024 | 182 | 019 |
| 28 Mar 2024 | 177 | 008 |
Régions solaires actives et éruptions solaires
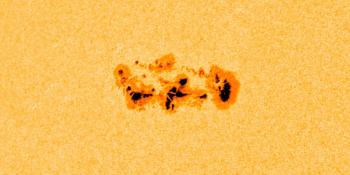
The solar flaring activity was at moderate levels. The largest flare of the period was an M1.9 flare with peak time 00:36 UTC March 26. This flare originated from Catania region 22 (NOAA AR 3615), which is the largest and most complex region on disk (Beta- Gamma-Delta). This region also produced two further M-class flares (M1 and M1.3 peaking at 10:17 UTC and 10:43 UTC, respectively). Catania region 21 (NOAA AR 3614) produced a C7.9 flare with peak time 15:27 UTC March 25. Catania region (NOAA AR 3619) also produced C-class flaring. The remaining regions on disk were mostly quiet. The solar flaring activity is expected to be at moderate levels over the next 24 hours with C-class flares expected, M-class flares likely and a low probability for an X-class flare.
Éjection de masse coronale
No Earth directed Coronal Mass Ejections (CMEs) have been detected in the available coronagraph imagery.
Vent solaire
The solar wind speed remained enhanced overall due to the ongoing ICME influence, but gradually decreased from values around 800 km/s to around 600 km/s. The interplanetary magnetic field ranged between 0 and 8 nT. The Bz component reached a minimum value of -4 nT. The interplanetary magnetic field phi angle switched into the positive sector from 15:23 UTC March 25. The Earth is expected to continue under the waning influence of this ICME over the next 24 hours with the enhanced solar wind speed expected to persist on March 26 and 27, as it continues to gradually decrease.
Géomagnétisme
Geomagnetic conditions reached active conditions (NOAA Kp 4 and Local K Bel 4) between 12:00 and 15:00 UTC March 25. Conditions then reduced to quiet to unsettled levels. Geomagnetic conditions are expected to be at unsettled to active conditions on March 26 and 27, with further minor storm conditions possible in response to any prolonged period of negative Bz while the Earth is still under the influence of the high solar wind speed of the ICME.
Niveaux de flux de protons
Over the past 24 hours the greater than 10 MeV GOES proton flux was above the 10pfu threshold at the start of the period (with a value of around 24 MeV as measured by GOES-16) and then gradually decreased to below the threshold from 15:25 UTC March 25. The proton flux is expected to remain slightly elevated but be below 10 Mev threshold over the next 24 hours.
Flux d'électrons sur l'orbite géostationnaire
The greater than 2 MeV electron flux remained below the 1000 pfu threshold as measured by GOES 16. It is expected to remain below this threshold over the next day. The 24-hour electron fluence was at nominal levels. The electron fluence is expected to be at nominal levels for the next day.
Estimation du nombre international de taches solaires (ISN) pour aujourd'hui : 143, sur la base de 09 stations.Indices solaires pour 25 Mar 2024
| Nombre de Wolf, observé par Catania | 194 |
| Flux solaire à 10 cm | 190 |
| AK Chambon La Forêt | 021 |
| AK Wingst | 022 |
| Ap estimé | 021 |
| Nombre international de taches solaires estimé | 166 - Basé sur 18 stations |
Résumé des événements marquants
| Jour | Commencer | Max | Fin | Loc | Force | OP | 10cm | Catania/NOAA | Types de sursaut radio |
|---|---|---|---|---|---|---|---|---|---|
| 26 | 0028 | 0036 | 0040 | S13W36 | M1.8 | SN | 22/3615 | V/3III/3 |
Données fournies par le Solar Influences Data analysis Center© - SIDC - Traité par SpaceWeatherLive
Toutes les heures sont indiquées en UTC
Dernières nouvelles
Complex sunspot region 4366

CME impact! S4 solar radiation storm

X1.9 solar flare with earth-directed CME
Forum
Aidez SpaceWeatherLive.com !
De nombreuses personnes consultent SpaceWeatherLive pour suivre l'activité solaire ou observer les aurores boréales, mais l'augmentation du trafic engendre des coûts plus élevés pour maintenir les serveurs en ligne. Si vous appréciez SpaceWeatherLive et souhaitez soutenir le projet, vous pouvez vous abonner pour un site sans publicité ou faire un don. Grâce à votre aide, SpaceWeatherLive restera accessible !


La Météo Spatiale en faits
| Dernière classe X | 04/02/2026 | X4.3 |
| Dernière classe M | 09/02/2026 | M2.8 |
| Dernier orage géomagnétique | 05/02/2026 | Kp5+ (G1) |
| Jours sans taches solaires | |
|---|---|
| Dernier jour sans taches solaires | 08/06/2022 |
| Nombre mensuel moyen de taches solaires | |
|---|---|
| janvier 2026 | 112.6 -11.4 |
| février 2026 | 132.1 +19.5 |
| 30 derniers jours | 128.6 +27.4 |