Affichage des archives de dimanche, 19 octobre 2025
Bulletin quotidien sur l'activité solaire et géomagnétique du SIDC
Publié: 2025 Oct 19 1235 UTC
Prévisions SIDC
Éruptions solaires
C-class flares expected, (probability >=50%)
Géomagnétisme
Minor storm expected (A>=30 or K=5)
Moniteur de Flux de Proton
Quiet
| Flux de 10 cm | Ap | |
|---|---|---|
| 19 Oct 2025 | 152 | 035 |
| 20 Oct 2025 | 149 | 029 |
| 21 Oct 2025 | 149 | 015 |
Régions solaires actives et éruptions solaires
Solar flaring activity was moderate over the past 24 hours with 1 M-class flare recorded. The largest flare was an M1.0 flare (SIDC Flare 5834), peaking on October 19 at 01:56 UTC and was produced by SIDC Sunspot Group 639 (NOAA Active Region 4246). This region is now beyond the west solar limb. There are 6 numbered sunspot groups on disk. SIDC Sunspot group 621 (NOAA Active region 4248), now the most complex region on disk, is also approaching the west solar limb. The remaining regions on disk were mostly quiet. The solar flaring activity is expected to be low over the next 24 hours, with C-class flares expected and a chance for M-class flares.
Éjection de masse coronale
No new Earth directed Coronal Mass Ejections (CMEs) were observed.
Vent solaire
The solar wind conditions reflected ongoing transient magnetic features, likely associated with the CMEs from October 15 and the start of the high-speed stream influence. The magnetic field ranged between 1 and 17 nT. From 13:00 to 21:00 UTC on October 18, there was a prolonged interval of negative Bz with a value of around -7nT. After this time, the Bz component reduced in magnitude and after 03:00 UTC October 19 became mostly positive. The solar wind speed was between 450 and 550 km/s for most of the period. The solar wind speed is expected to continue to be enhanced over the next 24 hours due to the influence of the high-speed stream associated with the negative polarity coronal hole (SIDC Coronal Hole 126).
Géomagnétisme
Geomagnetic conditions reached moderate storm levels globally (Kp 6), between 18:00 and 21:00 UTC on October 18, likely due to the ongoing influence of a glancing blow arrival of the CME of October 15. Locally, minor storm conditions were reached (K Bel 5). Active to minor storm conditions (Kp 4-5) are expected over the next 24 hours in response to the high-speed stream influence.
Niveaux de flux de protons
The greater than 10 MeV proton flux was below the 10 pfu threshold over the past 24 hours. It is expected to remain below this threshold level over the next 24 hours. There is a small chance of an increase related to any high-level flaring, particularly from SIDC Sunspot Group 639 (NOAA Active Region 4246) while it remains near the west solar limb.
Flux d'électrons sur l'orbite géostationnaire
The greater than 2 MeV electron flux measured by GOES 18 and GOES 19 was below the 1000 pfu threshold. The greater than 2 MeV electron flux is expected to remain below the 1000 pfu threshold over the next 24 hours. The 24-hour electron fluence was at normal levels and is expected to be at normal levels over the next 24 hours.
Estimation du nombre international de taches solaires (ISN) pour aujourd'hui : 107, sur la base de 05 stations.Indices solaires pour 18 Oct 2025
| Nombre de Wolf, observé par Catania | /// |
| Flux solaire à 10 cm | 156 |
| AK Chambon La Forêt | 059 |
| AK Wingst | 037 |
| Ap estimé | 040 |
| Nombre international de taches solaires estimé | 111 - Basé sur 18 stations |
Résumé des événements marquants
| Jour | Commencer | Max | Fin | Loc | Force | OP | 10cm | Catania/NOAA | Types de sursaut radio |
|---|---|---|---|---|---|---|---|---|---|
| 19 | 0146 | 0156 | 0204 | ---- | M1.0 | 58/4246 |
Données fournies par le Solar Influences Data analysis Center© - SIDC - Traité par SpaceWeatherLive
Toutes les heures sont indiquées en UTC
Dernières nouvelles
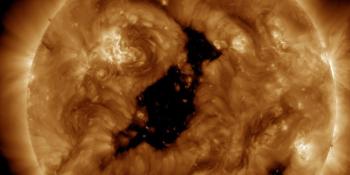
Coronal hole faces Earth

X1.5 solar flare

M2.7 solar flare, CME arrival possible
Forum
Aidez SpaceWeatherLive.com !
De nombreuses personnes consultent SpaceWeatherLive pour suivre l'activité solaire ou observer les aurores boréales, mais l'augmentation du trafic engendre des coûts plus élevés pour maintenir les serveurs en ligne. Si vous appréciez SpaceWeatherLive et souhaitez soutenir le projet, vous pouvez vous abonner pour un site sans publicité ou faire un don. Grâce à votre aide, SpaceWeatherLive restera accessible !


La Météo Spatiale en faits
| Dernière classe X | 24/04/2026 | X2.5 |
| Dernière classe M | 29/05/2026 | M1.1 |
| Dernier orage géomagnétique | 16/05/2026 | Kp6- (G2) |
| Jours sans taches solaires | |
|---|---|
| 365 derniers jours | 3 jours |
| 2026 | 3 jours (2%) |
| Dernier jour sans taches solaires | 24/02/2026 |
| Nombre mensuel moyen de taches solaires | |
|---|---|
| avril 2026 | 79.3 -6.6 |
| mai 2026 | 97.9 +18.6 |
| 30 derniers jours | 97.9 +5 |