Affichage des archives de dimanche, 8 février 2026
Bulletin quotidien sur l'activité solaire et géomagnétique du SIDC
Publié: 2026 Feb 08 1231 UTC
Prévisions SIDC
Éruptions solaires
M-class flares expected (probability >=50%)
Géomagnétisme
Active conditions expected (A>=20 or K=4)
Moniteur de Flux de Proton
Quiet
| Flux de 10 cm | Ap | |
|---|---|---|
| 08 Feb 2026 | 169 | 013 |
| 09 Feb 2026 | 169 | 013 |
| 10 Feb 2026 | 169 | 007 |
Régions solaires actives et éruptions solaires
A total of 9 numbered sunspot groups were identified on the disk over the past 24 hours. There were two M-class flares in the last 24 hours. Both flares occurred close in time, the first one was an M1.8 peaking on February 8 at 11:18 UTC and the second one was an M1.7 on February 8 at 11:43 UTC. Both were produced by SIDC Sunspot Group 784 (NOAA Active Region 4366) currently located at N13W45 with a Beta-Gamma-Delta magnetic configuration. This region remains the largest and most complex on disk. Solar flaring activity is expected to be moderate over the next 24 hours, with M-class flares likely.
Éjection de masse coronale
No Earth directed CMEs were observed in the past 24 hours.
Trous coronaux
There are two equatorial coronal holes on the equator and on the western hemisphere: SIDC Coronal Hole 136 and 149 (equatorial coronal holes with a negative polarity). SIDC Coronal Hole 142 (mid-latitude coronal hole with a negative polarity) is also on the west, but at higher latitudes.
Vent solaire
The solar wind speed at Earth is at 450 km/s. The interplanetary magnetic field is around 6 nT. In the coming 24 hours, the solar wind speed is expected to increase due to the influence of coronal hole associated high speed streams (from SIDC 149 and probably also 142).
Géomagnétisme
Geomagnetic conditions have reached active periods at planetary levels in the last 24 hours (Kp up to 4), and only unsettled locally (K_Bel up to 3). Similar unsettled to active conditions can be expected for the next 24 hours.
Niveaux de flux de protons
The greater than 10 MeV proton flux remained below the 10 pfu threshold in the last 24 hours. Similar conditions can be expected for the next 24 hours.
Flux d'électrons sur l'orbite géostationnaire
The greater than 2 MeV electron flux as measured by GOES 19 was above the threshold between 12:00 UTC and 23:00 UTC on 7 February and GOES 18 between 14:00 UTC on 7 February and 02:00 UTC on 8 February. The flux is expected to remain below the threshold for the next 24 hours. The 24-hour electron fluence was at normal levels and is expected to remain so.
Estimation du nombre international de taches solaires (ISN) pour aujourd'hui : 150, sur la base de 11 stations.Indices solaires pour 07 Feb 2026
| Nombre de Wolf, observé par Catania | /// |
| Flux solaire à 10 cm | 169 |
| AK Chambon La Forêt | 026 |
| AK Wingst | 017 |
| Ap estimé | 018 |
| Nombre international de taches solaires estimé | 140 - Basé sur 18 stations |
Résumé des événements marquants
| Jour | Commencer | Max | Fin | Loc | Force | OP | 10cm | Catania/NOAA | Types de sursaut radio |
|---|---|---|---|---|---|---|---|---|---|
| 08 | 1113 | 1118 | 1121 | ---- | M1.8 | 10/4366 |
Données fournies par le Solar Influences Data analysis Center© - SIDC - Traité par SpaceWeatherLive
Toutes les heures sont indiquées en UTC
Dernières nouvelles

X1.5 solar flare

M2.7 solar flare, CME arrival possible
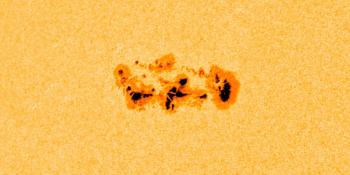
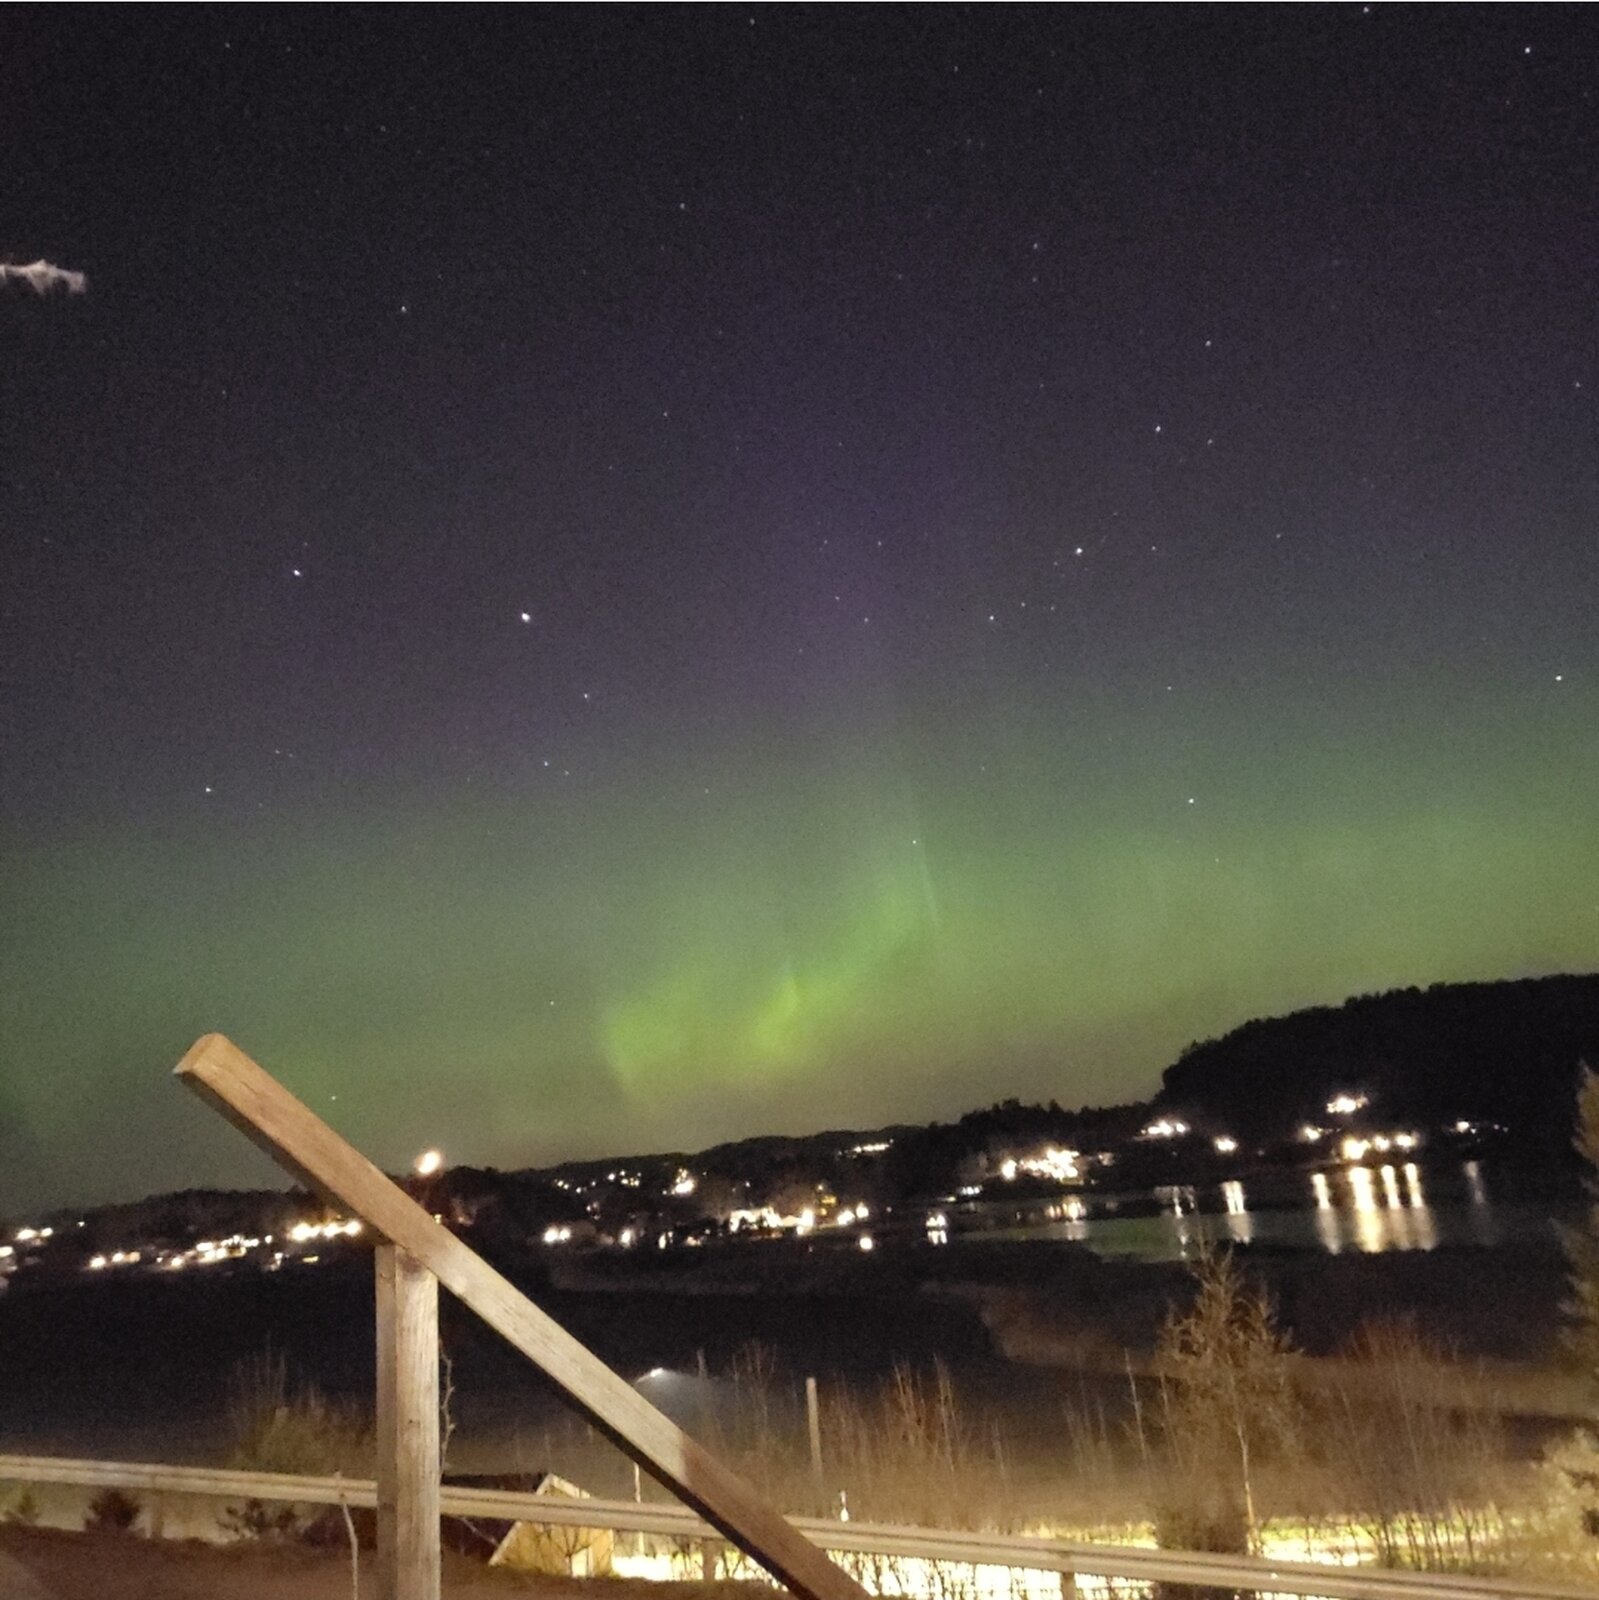
Complex sunspot region 4366
Forum
Aidez SpaceWeatherLive.com !
De nombreuses personnes consultent SpaceWeatherLive pour suivre l'activité solaire ou observer les aurores boréales, mais l'augmentation du trafic engendre des coûts plus élevés pour maintenir les serveurs en ligne. Si vous appréciez SpaceWeatherLive et souhaitez soutenir le projet, vous pouvez vous abonner pour un site sans publicité ou faire un don. Grâce à votre aide, SpaceWeatherLive restera accessible !


La Météo Spatiale en faits
| Dernière classe X | 30/03/2026 | X1.5 |
| Dernière classe M | 09/04/2026 | M1.0 |
| Dernier orage géomagnétique | 20/04/2026 | Kp5 (G1) |
| Jours sans taches solaires | |
|---|---|
| 365 derniers jours | 3 jours |
| 2026 | 3 jours (3%) |
| Dernier jour sans taches solaires | 24/02/2026 |
| Nombre mensuel moyen de taches solaires | |
|---|---|
| mars 2026 | 85.9 +7.7 |
| avril 2026 | 79.3 -6.7 |
| 30 derniers jours | 92.3 +25.9 |