Affichage des archives de vendredi, 20 février 2026
Bulletin quotidien sur l'activité solaire et géomagnétique du SIDC
Publié: 2026 Feb 20 1245 UTC
Prévisions SIDC
Éruptions solaires
C-class flares expected, (probability >=50%)
Géomagnétisme
Moderate (ISES: Major) magstorm expected (A>=50 or K=6)
Moniteur de Flux de Proton
Quiet
| Flux de 10 cm | Ap | |
|---|---|---|
| 20 Feb 2026 | 115 | 027 |
| 21 Feb 2026 | 114 | 013 |
| 22 Feb 2026 | 114 | 011 |
Régions solaires actives et éruptions solaires
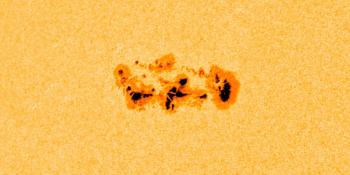
Solar flaring activity was low over the past 24 hours, with only C-class flares identified. The largest flare was a C2.8 flare (SIDC Flare 7053) peaking on February 20 at 03:07 UTC, which was produced by SIDC Sunspot Group 795 (NOAA Active Region 4377). A total of 4 numbered sunspot groups were identified on the disk over the past 24 hours. SIDC Sunspot Group 762 (NOAA Active Region 4374) is the most complex region with its beta magnetic configuration, and it was stable over the past 24 hours. Solar flaring activity is expected to be low over the next 24 hours, with C-class flares very likely and a chance for M-class flares.
Éjection de masse coronale
Two or more coronal mass ejections (CMEs), with angular widths of about 60 deg, were observed in the available SOHO/LASCO-C2 images, starting from 21:12 UTC on Feb 19 on SE limb. First one was associated to a filament eruption near the SE limb which was observed in SDO/AIA 193Å and 94Å images, but it had no Earth-directed components. Further CMEs are also possibly associated to further filament eruption from the same region. No other Earth-directed CMEs were detected in the available coronagraph observations during the last 24 hour.
Trous coronaux
A negative polarity, recurrent coronal hole which spans 10 S to 30 N, began to traverse the central meridian on Feb 20. The associated high speed streams are expected to arrive at Earth from Feb 23. SIDC Coronal Hole 146 which is an elongated, positive polarity, recurrent coronal hole is still crossing the central meridian since Feb 13.
Vent solaire
Over the past 24 hours, solar wind parameters continued to reflect the waning influence of a high-speed stream (HSSs) from the elongated, positive polarity, recurrent coronal hole (SIDC Coronal Hole 146) which started to cross the central meridian on Feb 13. The solar wind speed increases occasionally due to the irregular shape of the same coronal hole. The solar wind speed ranged from 425 km/s to 590 km/s. The interplanetary magnetic field ranged between 4 nT and 10 nT, and the North- South component (Bz) ranged between -3 nT and 6 nT. In the next 24 hours, mildly enhanced solar wind conditions are possible due to the irregular shape of the same coronal hole and then later a gradual transition to slow solar wind. Solar wind conditions may also be enhanced if the interplanetary coronal mass ejection (ICME) associated to the CME (associated to a filament eruption) that was observed lifting from the Sun in the afternoon of Feb 16 arrives late.
Géomagnétisme
Geomagnetic conditions were globally and locally at quiet to unsettled conditions (NOAA Kp and K BEL 1 to 3), during the past 24 hours. Quiet to unsettled conditions are expected in the next 24 hours. Active to moderate storm conditions are possible, if interplanetary coronal mass ejection (ICME) associated to the CME (associated to a filament eruption) that was observed lifting from the Sun in the afternoon of Feb 16 arrives late.
Niveaux de flux de protons
The greater than 10 MeV GOES proton flux was below the threshold level over the past 24 hours and it is expected to remain so for the next 24 hours.
Flux d'électrons sur l'orbite géostationnaire
The greater than 2 MeV electron flux, as measured by GOES-18 satellite, increased and exceeded the 1000 pfu threshold level from 13:30 UTC on Feb 19 to 04:00 UTC on Feb 20 over the past 24 hours. It is above the threshold level since 11:50 UTC on Feb 20 and is expected to remain so mostly in the next 24 hours. The greater than 2 MeV electron flux, as measured by GOES-19 satellite, exceeded above the 1000 pfu threshold level around 12:00 UTC on Feb 19 and dropped below the threshold level around 00:10 UTC on Feb 20. It was then fluctuating around the threshold and again went above the threshold level since 08:10 UTC on Feb 20 and expected to remain so. It was in response to the high speed streams (HSS) from the elongated, positive polarity, coronal hole (SIDC Coronal Hole 146) which started to cross the central meridian since Feb 13. The 24h electron fluence was at moderate levels and is expected to remain at moderate level in the coming 24 hours.
Estimation du nombre international de taches solaires (ISN) pour aujourd'hui : 041, sur la base de 07 stations.Indices solaires pour 19 Feb 2026
| Nombre de Wolf, observé par Catania | 067 |
| Flux solaire à 10 cm | 116 |
| AK Chambon La Forêt | 017 |
| AK Wingst | 011 |
| Ap estimé | 011 |
| Nombre international de taches solaires estimé | 042 - Basé sur 17 stations |
Résumé des événements marquants
| Jour | Commencer | Max | Fin | Loc | Force | OP | 10cm | Catania/NOAA | Types de sursaut radio | |
|---|---|---|---|---|---|---|---|---|---|---|
| Aucun | ||||||||||
Données fournies par le Solar Influences Data analysis Center© - SIDC - Traité par SpaceWeatherLive
Toutes les heures sont indiquées en UTC
Dernières nouvelles
Complex sunspot region 4366

CME impact! S4 solar radiation storm

X1.9 solar flare with earth-directed CME
Aidez SpaceWeatherLive.com !
De nombreuses personnes consultent SpaceWeatherLive pour suivre l'activité solaire ou observer les aurores boréales, mais l'augmentation du trafic engendre des coûts plus élevés pour maintenir les serveurs en ligne. Si vous appréciez SpaceWeatherLive et souhaitez soutenir le projet, vous pouvez vous abonner pour un site sans publicité ou faire un don. Grâce à votre aide, SpaceWeatherLive restera accessible !


La Météo Spatiale en faits
| Dernière classe X | 04/02/2026 | X4.21 |
| Dernière classe M | 25/02/2026 | M2.4 |
| Dernier orage géomagnétique | 22/02/2026 | Kp5+ (G1) |
| Jours sans taches solaires | |
|---|---|
| 365 derniers jours | 3 jours |
| 2026 | 3 jours (5%) |
| Dernier jour sans taches solaires | 24/02/2026 |
| Nombre mensuel moyen de taches solaires | |
|---|---|
| janvier 2026 | 112.6 -11.4 |
| mars 2026 | 85 -27.6 |
| 30 derniers jours | 71 -47.7 |