Latest HUXt Forecast animation
This animation shows our latest forecast of the solar wind and solar eruptions (coronal mass ejections, CMEs). The presented view looks down on Earth’s orbital plane i.e. looking down on the north pole of the Sun. The forecast takes solar observations processed by the UK Met Office (UKMO), which are used as inputs to the University of Reading solar wind model HUXt.
Latest HUXt Forecast
Latest HUXt Forecast Animation
Latest HUXt Forecast
Latest HUXt Forecast Animation
Latest HUXt Forecast
Latest HUXt Forecast Animation
Latest HUXt Forecast
Latest HUXt Forecast Animation
Latest HUXt Forecast
Latest HUXt Forecast Animation
Latest HUXt Forecast
Latest HUXt Forecast Animation
Forecast Guide
The HUXt ensemble forecast takes two data inputs:
- UKMO estimates of the solar wind speed close to the Sun (at 21.5 rS). This comes from the WSA model driven with daily-updated magnetograms.
- UKMO estimates of CME properties (speed, direction, width) at 21.5 rS, from fitting the cone model to coronagraph observations
These are the two standard inputs to the WSA-Enlil solar wind model, which is used to produce the standard SWPC and UKMO forecasts. We perturb both inputs (solar wind and CME properties) within some reasonable ranges to generate large ensembles of different initial conditions at 21.5 rS. Each is propagated to Earth using HUXt, which is intended to capture the uncertainty in the forecast conditions at Earth.
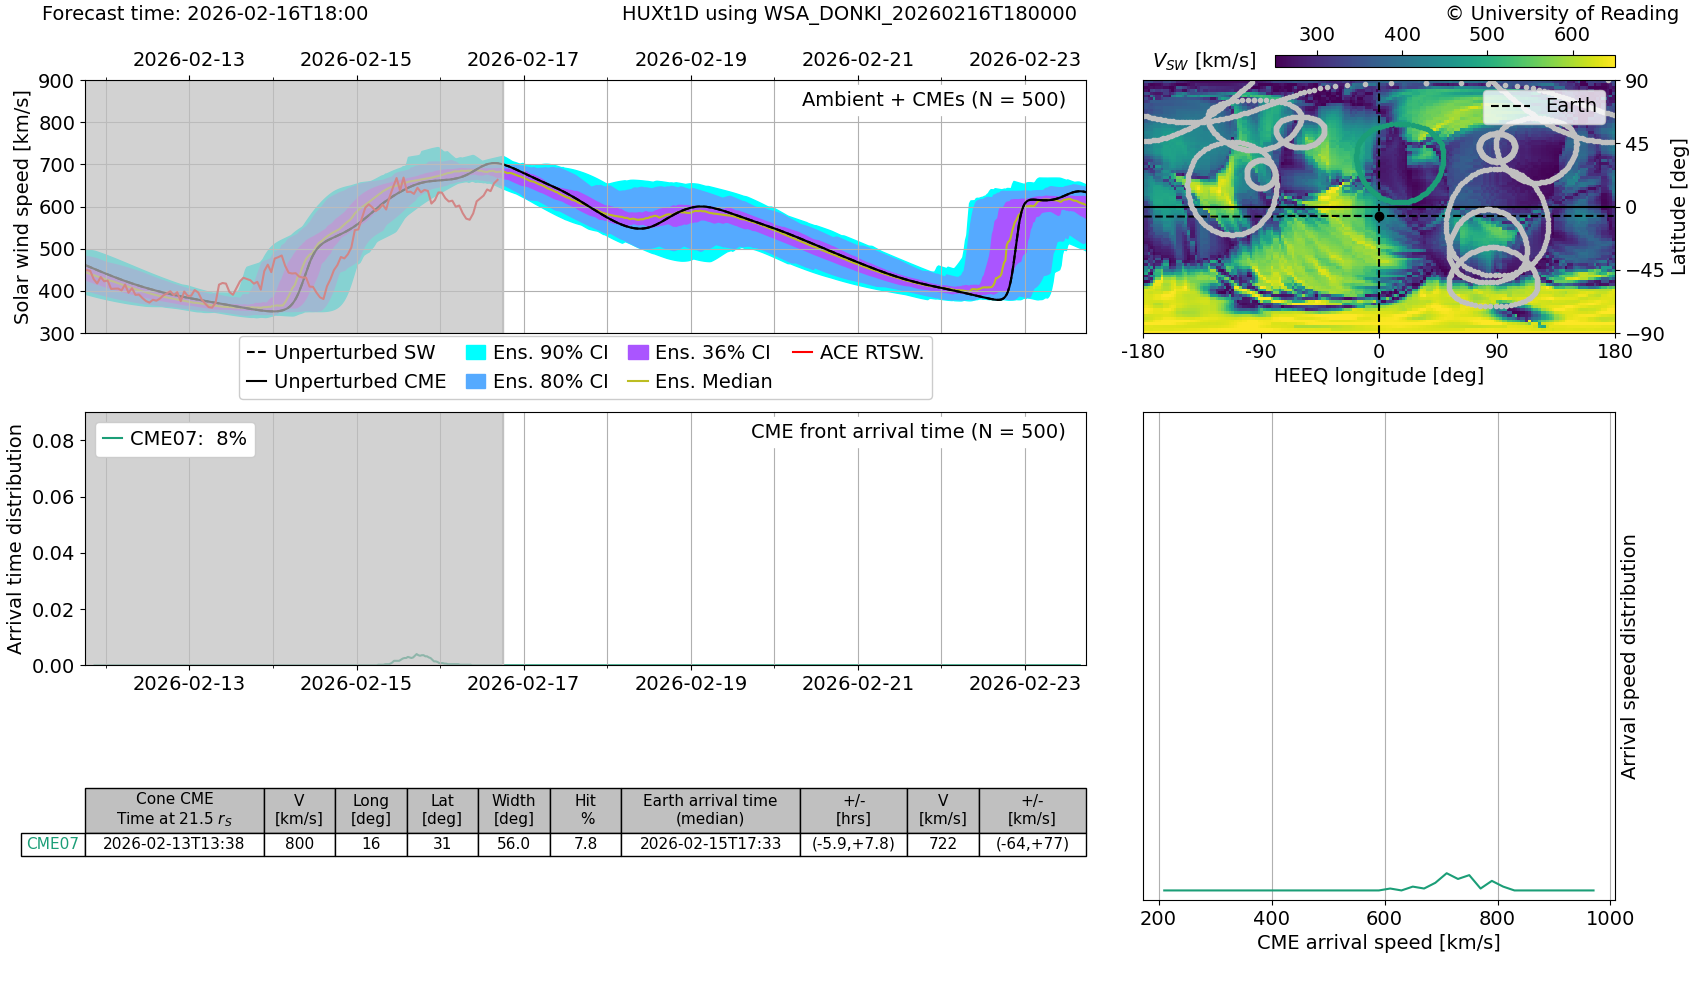
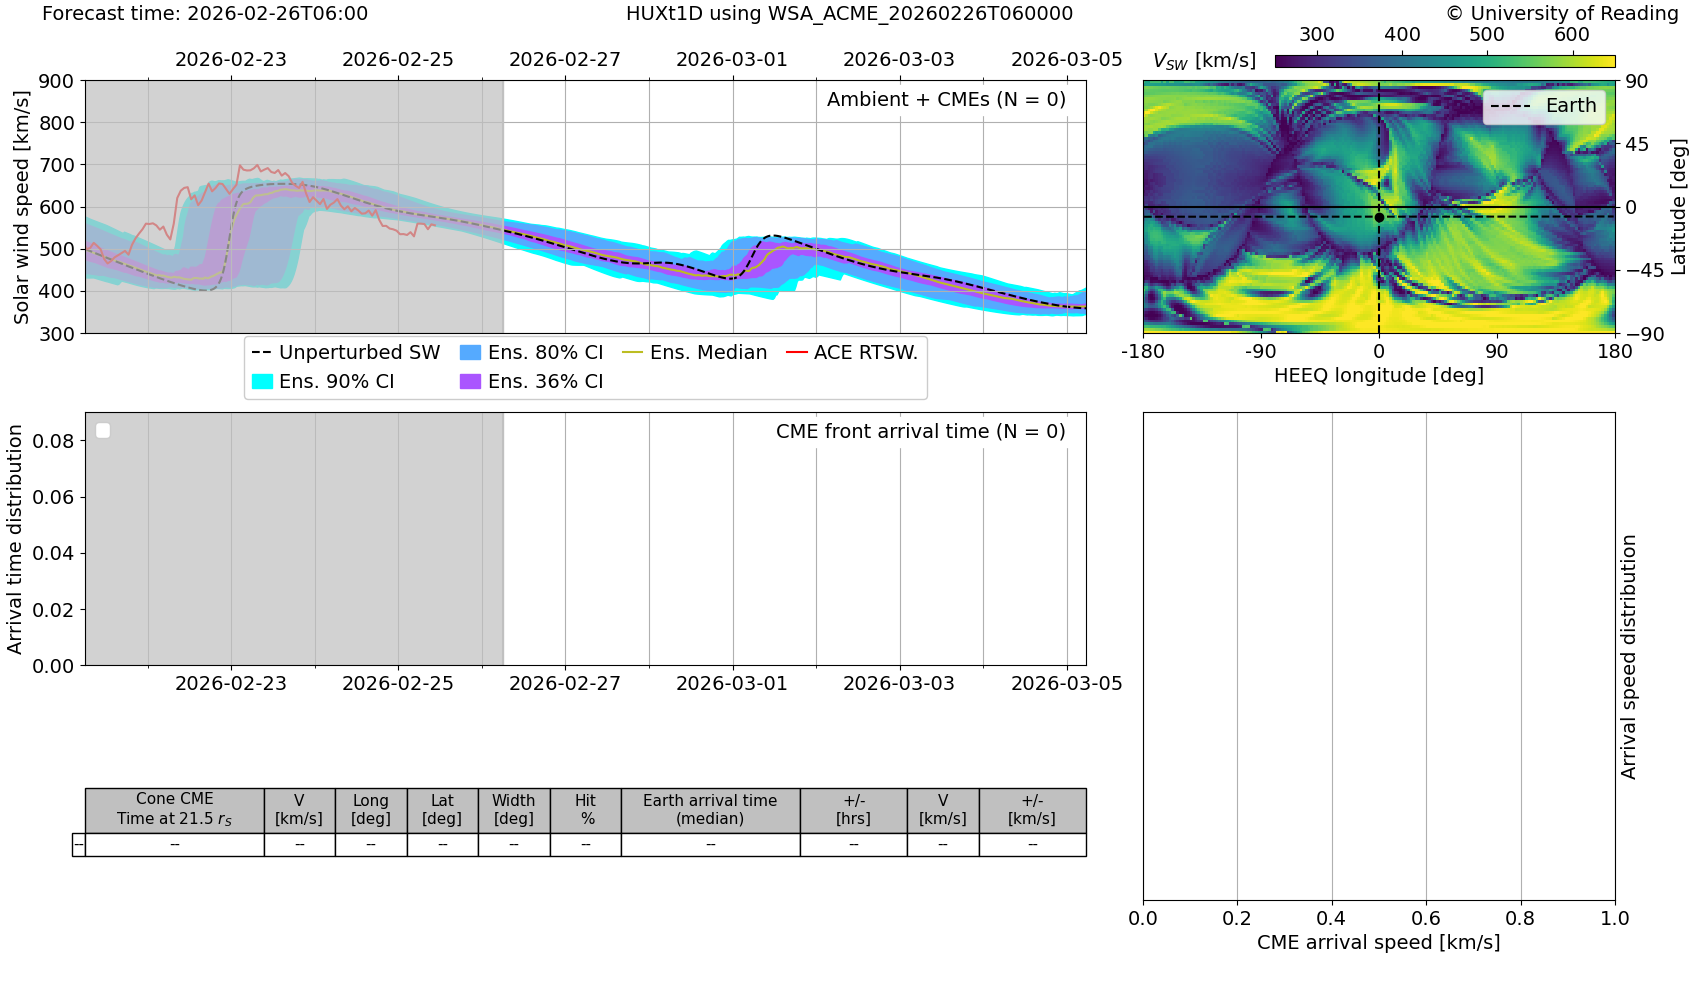
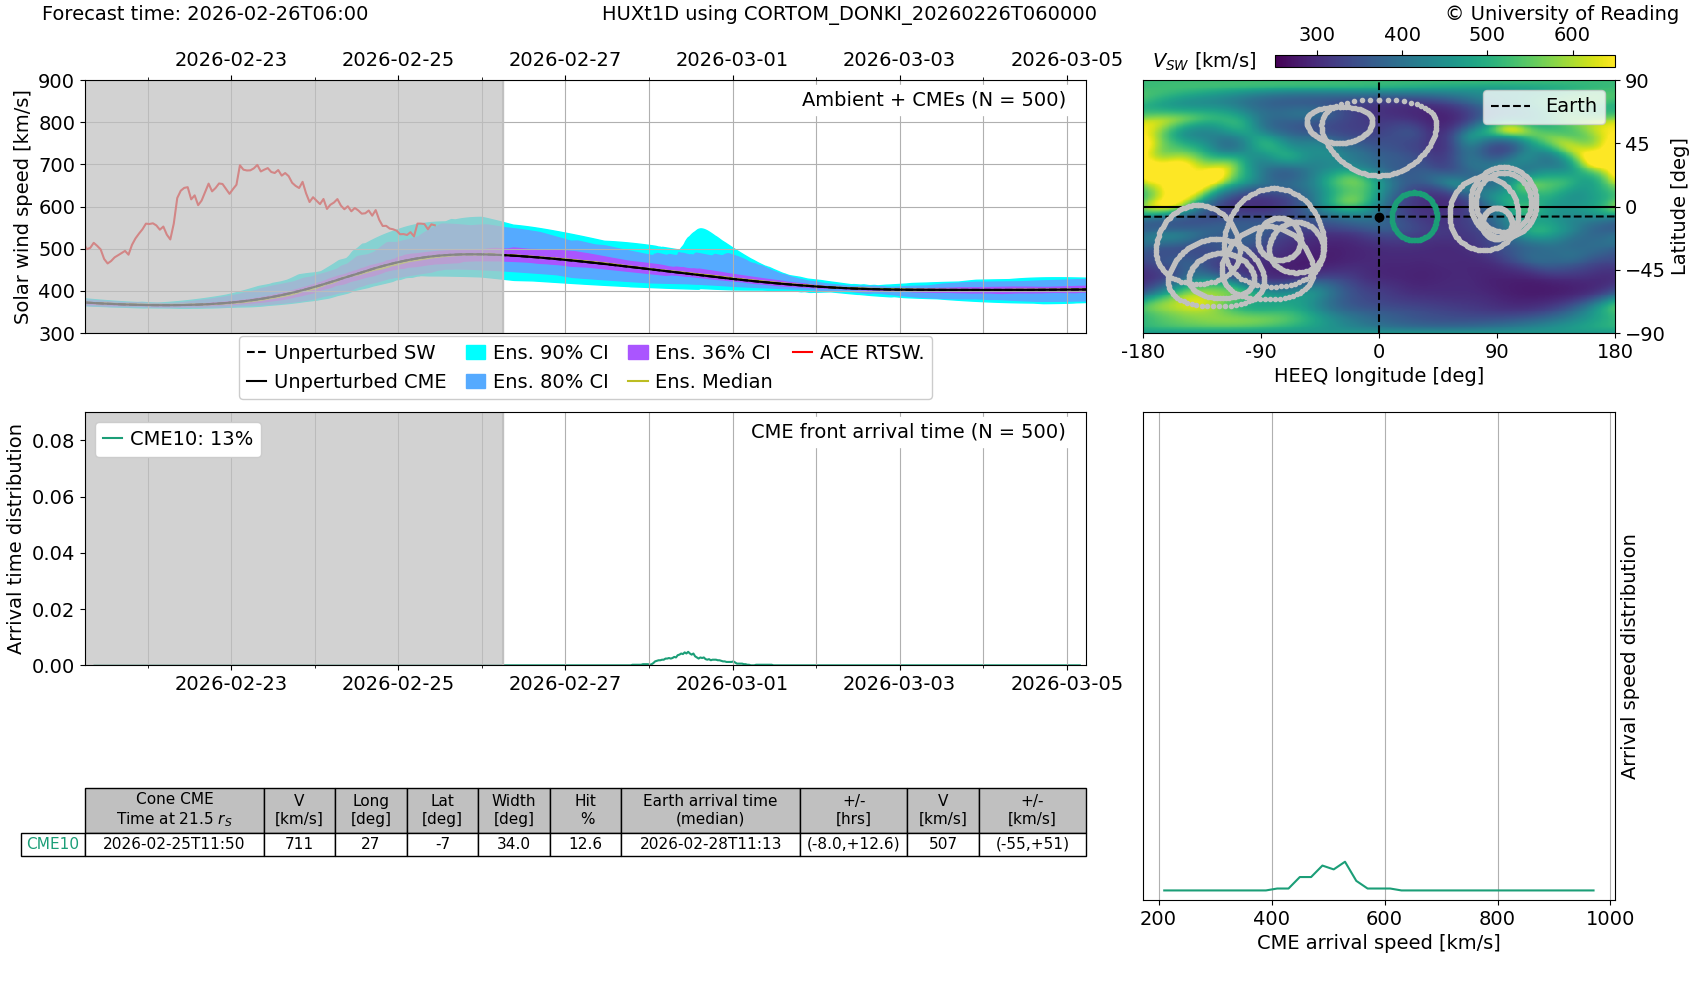
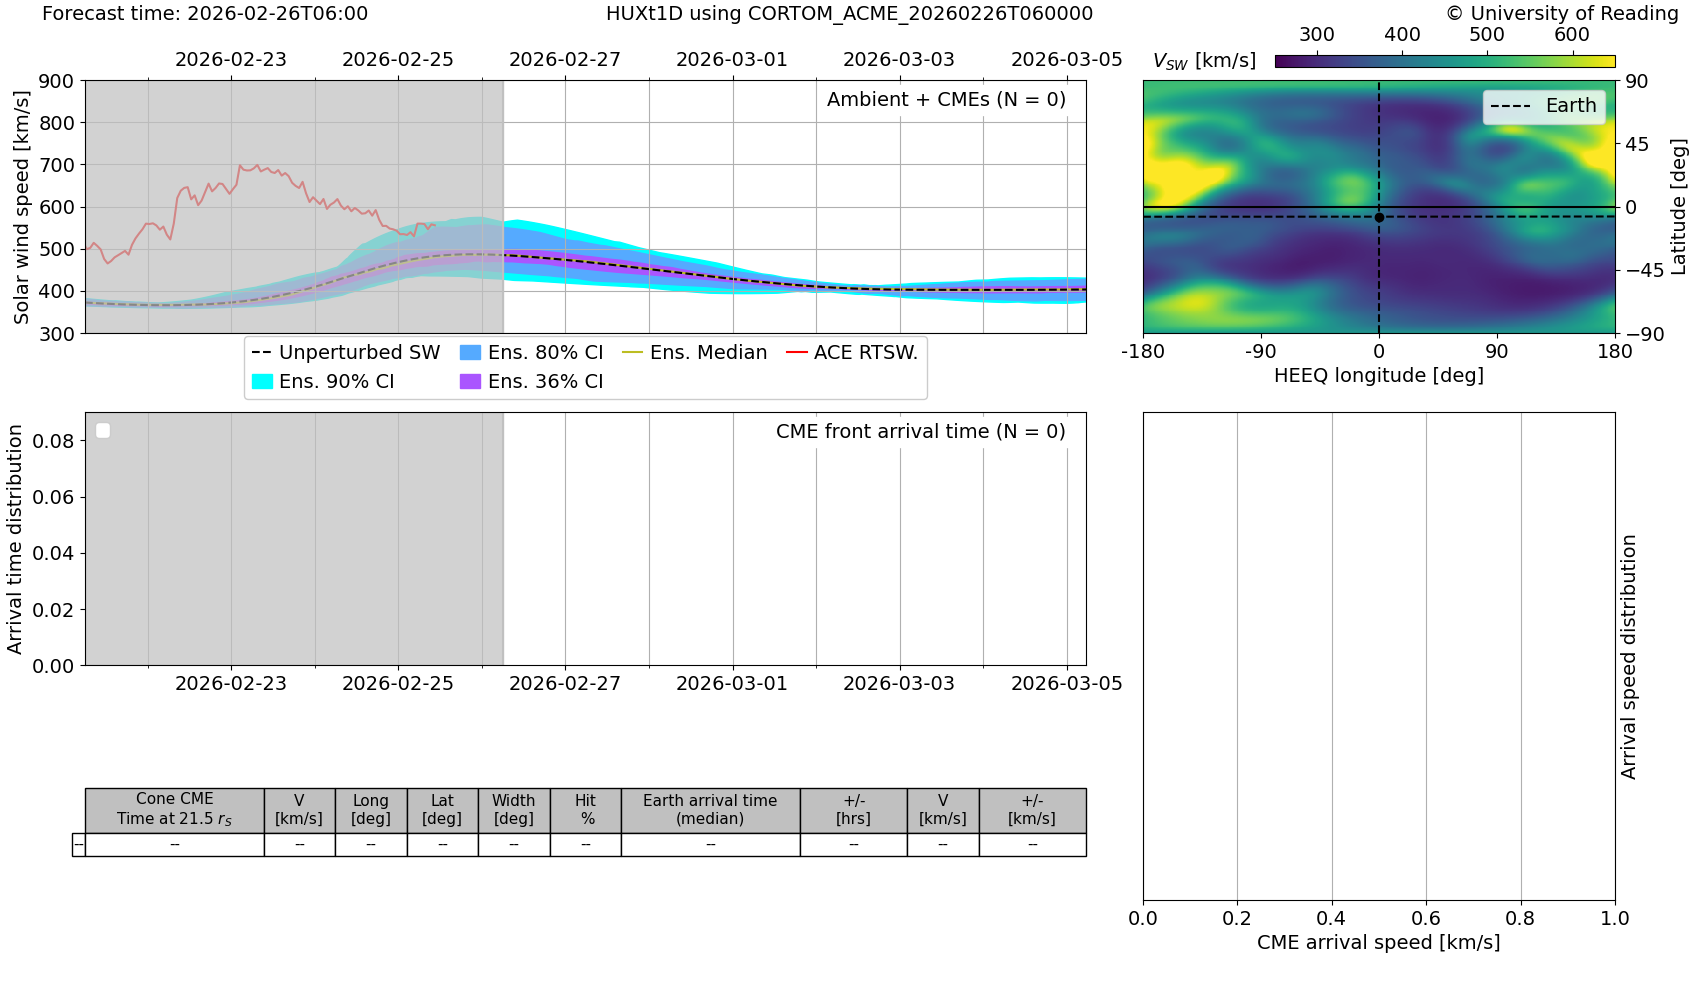
Dashboard panel descriptions
Top-left
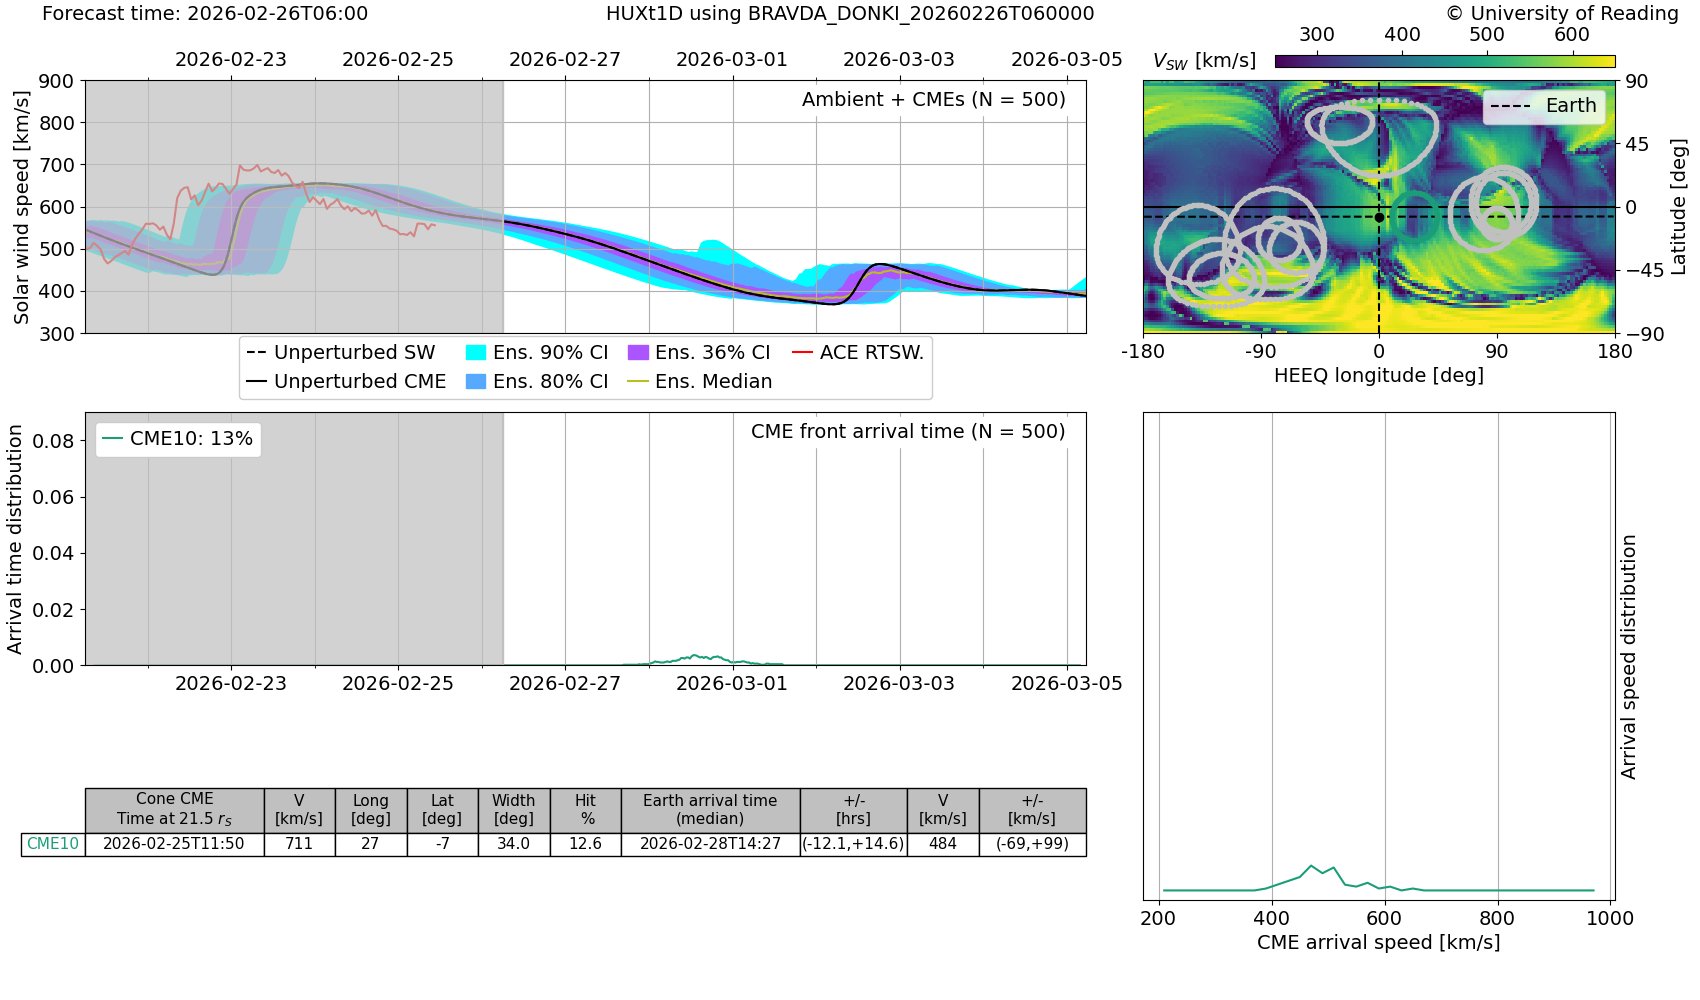
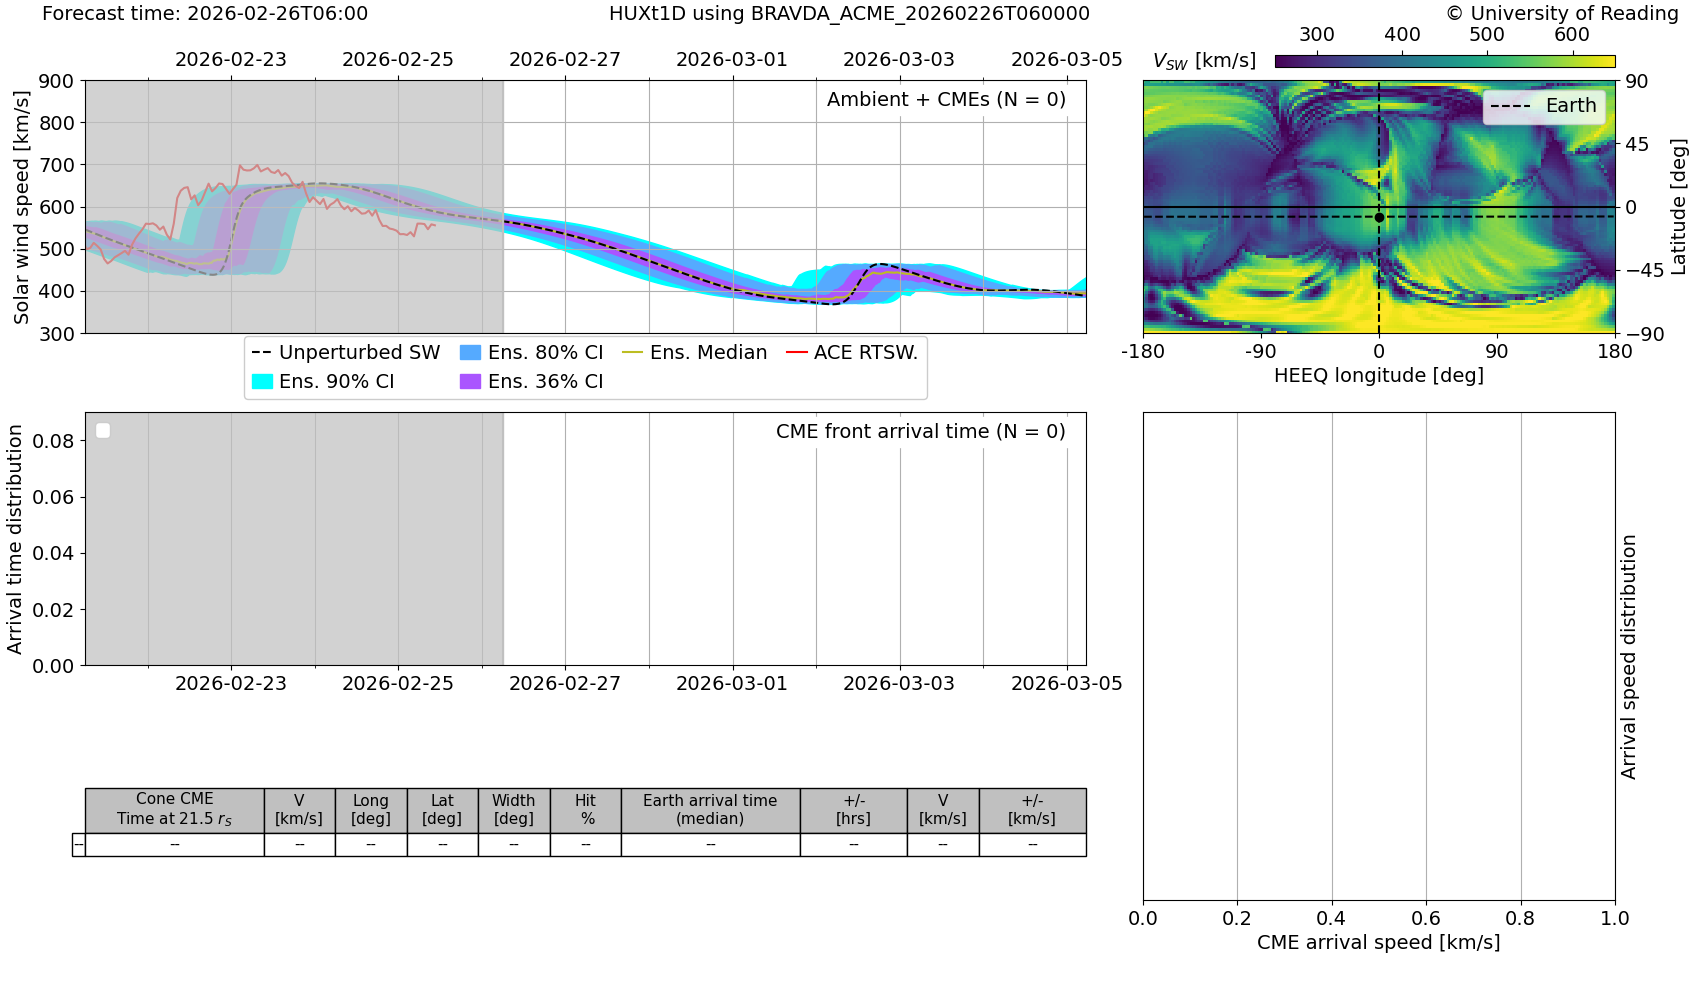
Time series of solar wind speed, for the model spin-up period (grey) and the forecast interval (white). The black line is the "deterministic" forecast - HUXt run with the WSA solution and CME parameters, without any perturbation. This should be similar to the standard WSA-Enlil forecast. The white line is the HUXt ensemble median, the blue/purple coloured bands are percentiles of the ensemble. When the bands are narrow/broad, the forecast has high/low confidence. The observed real-time solar wind speed from DSCOVR is shown in red for the last 5 days, but these are increasingly unreliable owing to issues with DSCOVR.
Middle-left
Time series of CME arrival probability at Earth. It's the fraction of ensemble members that predict a particular CME will arrival at Earth within a particular time window. The total area under a given curve is a measure of the confidence that CME will arrive at Earth. A narrow peak suggests a high confidence in the arrival time. A broader peak suggests low confidence in the arrival time.
Bottom-left
Table of the Earth-directed CME properties and forecast arrival times/speeds.
Top-right
Summary of the input data. The colour map shows the WSA solar wind speed at 21.5 rS in HEEQ coordinates. Overlaid are the positions and widths of CMEs identified by Met Office observers. Those with a possibility of Earth impact are assigned a colour used in other panels.
Bottom-right
The probability density of CME arrival speeds, for the Earth-impacting CMEs only. The total area under the curve is a measure of the confidence a CME will arrive at Earth. A narrow/broad peak suggests a high/low confidence in the arrival speed.
Ultime notizie
G3 geomagnetic storm watch for 4 and 5 June
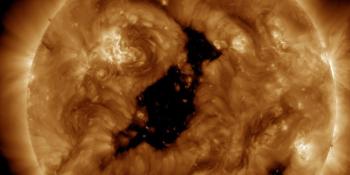
Coronal hole faces Earth

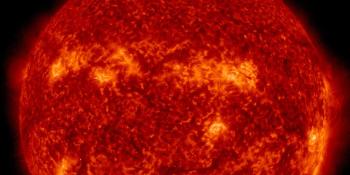
X1.5 solar flare
Ultimi messaggi dal forum
Supporta SpaceWeatherLive.com!
A lot of people come to SpaceWeatherLive to follow the Solar activity or if there is a chance to see the aurora, but with more traffic comes higher costs to keep the servers online. If you like SpaceWeatherLive and want to support the project you can choose a subscription for an ad-free site or consider a donation. With your help we can keep SpaceWeatherLive online!


Notizie sul meteo spaziale
| Ultimo brillamento X | 2026/06/03 | X1.0 |
| Ultimo brillamento M | 2026/06/03 | M7.76 |
| Ultima tempesta geomagnetica | 2026/05/16 | Kp6- (G2) |
| Giorni senza macchie | |
|---|---|
| Ultimi 365 giorni | 3 giorni |
| 2026 | 3 giorni (2%) |
| Ultimo giorno senza macchie | 2026/02/24 |
| Media mensile Numero di Macchie Solari | |
|---|---|
| maggio 2026 | 101.4 +22.1 |
| giugno 2026 | 144.3 +42.8 |
| Ultimi 30 giorni | 98.8 +5.2 |