Przeglądasz Archiwum z niedziela, 31 marca 2024
Codzienne wiadomości na temat aktywności słonecznej i geomagnetycznej z SIDC
Odnotowany: 2024 Mar 31 1240 UTC
Prognoza SIDC
Rozbłyski słoneczne
M-class flares expected (probability >=50%)
Geomagnetyzm
Active conditions expected (A>=20 or K=4)
Monitoring przepływu protonów
Quiet
| strumień 10cm | Ap | |
|---|---|---|
| 31 Mar 2024 | 135 | 014 |
| 01 Apr 2024 | 129 | 016 |
| 02 Apr 2024 | 132 | 010 |
Aktywne obszary słoneczne i rozbłyski
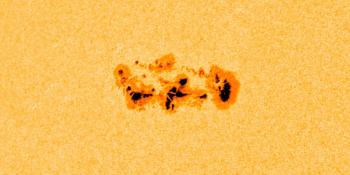
The solar flaring activity was at moderate. The largest flare of the period was a long duration M9.4 flare with peak time 21:16 UTC March 30. This flare originated from Catania region 22 (NOAA AR 3615), which has now almost fully rotated over the west limb. Two new, small regions have emerged, one in the east numbered NOAA AR 3624 and one (as yet unnumbered) near N18E11. These along with Catania regions 24 and 28 (NOAA AR 3617 and 3619) are simple and quiet. The solar flaring activity is expected to be at moderate levels over the next 24 hours, with possible further flares from Catania region 22 as it remains just over the limb, with C-class flares expected, M-class flares likely and a low probability for an X-class flare.
Koronalny wyrzut masy
No Earth directed Coronal Mass Ejections (CMEs) have been detected in the available coronagraph imagery.
Dziury koronalne
A negative polarity northern polar coronal hole that extends down to midlatitudes began to cross the central meridian on March 31.
Wiatr słoneczny
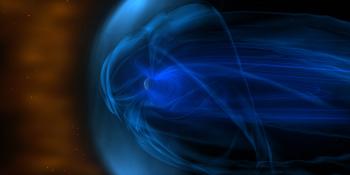
The solar wind conditions the arrival of the high-speed stream from the positive polarity coronal hole, which began to traverse the central meridian on March 27. The solar wind speed gradually increased from values around 315 km/s to around 530 km/s. The interplanetary magnetic field gradually increased, reaching a maximum value of 14nT at 23:20 UTC March 30 before decreasing to values around 5nT. The Bz component reached a minimum value of -10 nT at 00:12 UTC March 31. The interplanetary magnetic field phi was in the positive sector (directed away from the Sun). The Earth is expected to continue to be under the influence of this high-speed stream on March 31 and April 01.
Geomagnetyzm
Geomagnetic conditions were at unsettled to active levels (NOAA Kp 4- and Local K Bel 4). Geomagnetic conditions are expected to be at unsettled to active levels on March 31 and April 01.
Poziomy przepływu protonów
Over the past 24 hours the greater than 10 MeV GOES proton flux was below the 10pfu threshold and is expected to remain below this threshold for the next 24 hours. There is a small chance of an increase from flares associated with Catania region 22 (NOAA AR 3615).
Strumienie elektronów na orbicie geostacjonarnej
The greater than 2 MeV electron flux increased slightly but remained below the 1000 pfu threshold as measured by GOES 16. It is expected to remain below this threshold over the next days. The 24-hour electron fluence was at nominal levels. The electron fluence is expected to be at nominal levels over the next day.
Dzisiejsza szacunkowa międzynarodowa liczba plam na Słońcu (ISN): 066, na podstawie 19 stacji.Indeksy solarne na 30 Mar 2024
| Liczba Wolfa z Katanii | /// |
| Fale radiowe 10,7 cm | 140 |
| AK Chambon La Forêt | 016 |
| AK Wingst | 005 |
| Szacunkowa Ap | 005 |
| Szacowana międzynarodowa liczba plam słonecznych | 048 - Na podstawie stacji 22 |
Podsumowanie wydarzeń godnych uwagi
| Dzień | Początek | Maksymalnie | Koniec | Lokalizacja | Siła | OP | 10cm | Katania/NOAA | Typy impulsów radiowych |
|---|---|---|---|---|---|---|---|---|---|
| 30 | 2101 | 2116 | 2215 | ---- | M9.4 | --/3515 | I/2 |
Dostarczone przez Centrum Analizy Danych Wpływów Słonecznych© - SIDC - Przetworzone przez SpaceWeatherLive
Wszystkie czasy w UTC
<< Idź do codziennego przeglądu
Najnowsze wiadomości
Complex sunspot region 4366
CME impact! S4 solar radiation storm

X1.9 solar flare with earth-directed CME
Najnowsze wiadomości z forum
Wesprzyj SpaceWeatherLive.com!
Wiele ludzi odwiedza stronę SpaceWeatherLive, aby śledzić aktywność słońca lub czy jest szansa na zobaczenie zorzy, ale większy ruch powoduje większe koszty utrzymania serwerów. Jeżeli podoba ci się strona SpaceWeatherLive i chciałbyś/chciałabyś wesprzeć ten projekt to możesz kupić subskrypcje aby uzyskać dostęp do strony bez reklam lub kupić darowiznę. Dzięki waszej pomocy, pomagacie utrzymać serwery SpaceWeatherLive!


Fakty na temat pogody kosmicznej
| Ostatnie rozbłyski klasy X | 2026/02/04 | X4.3 |
| Ostatnie rozbłyski klasy M | 2026/02/08 | M2.8 |
| Ostatnia burza geomagnetyczna | 2026/02/05 | Kp5+ (G1) |
| Dni bez plam słonecznych | |
|---|---|
| Ostatni dzień bez plamy słonecznej | 2022/06/08 |
| Średnia miesięczna liczba plam słonecznych | |
|---|---|
| stycznia 2026 | 112.6 -11.4 |
| lutego 2026 | 137.7 +25.1 |
| Ostatnie 30 dni | 127.6 +24.1 |