Перегляд архіву субота, 28 червня 2025
Щоденний бюлетень про сонячну та геомагнітну активність від SIDC
Випущено: 2025 Jun 28 1244 UTC
Прогноз SIDC
Сонячні спалахи
C-class flares expected, (probability >=50%)
Геомагнетизм
Active conditions expected (A>=20 or K=4)
Сонячні протони
Quiet
| 10 см потік | Ap | |
|---|---|---|
| 28 Jun 2025 | 117 | 013 |
| 29 Jun 2025 | 117 | 013 |
| 30 Jun 2025 | 115 | 011 |
Сонячно-активні області та спалахи
Solar flaring activity was low over the past 24 hours, with only C-class flares identified. The largest flare was a C1.2 flare (SIDC Flare 4769) peaking on June 27 at 13:33 UTC, which was produced by SIDC Sunspot Group 530 (NOAA Active Region 4120). During the flare, the source region (AR 4120) of the flare had beta-gamma configuration of its photospheric magnetic field. A total of 10 numbered sunspot groups were identified on the disk over the past 24 hours. The solar flaring activity is expected to be at low to moderate levels over the next 24 hours with C-class flares expected, M-class flares probable, and a small chance of X-class flares.
Корональні викиди маси
A narrow coronal mass ejection (CME) was observed in SOHO/LASCO-C2 images around 11:48 UTC on Jun 27 (as detected by CACTUS tool). It was associated with a filament eruption on NW quadrant of the Sun, which was part of an extended filament in the northern hemisphere. This CME is not expected to arrive at Earth. No other Earth-directed CMEs were detected in the available coronagraph observations during last 24 hour.
Сонячний вітер
Earth is still inside a fast solar wind stream, with the continuous arrival of high speed streams (HSSs) from the large SIDC Coronal Hole 116 (negative polarity) which crossed the central meridian during Jun 21-25. The solar wind speed ranged from 575 km/s to 775 km/s. The interplanetary magnetic field ranged between 1 nT and 5 nT, and the North- South component (Bz) ranged between -4 nT and 4 nT. In the next 24 hours, enhanced solar wind conditions are expected to continue until Jun 28 with the further arrival of HSSs from the same coronal hole.
Геомагнетизм
Geomagnetic conditions were at quiet to unsettled conditions (NOAA Kp 2 to 3), both globally and locally during the past 24 hours. In the next 24 hours, quiet to active conditions (K 1 to 4) are possible with the continuous arrival of HSSs from the same coronal hole.
Рівні потоку протонів
The greater than 10 MeV GOES proton flux was below the threshold level over the past 24 hours and it is expected to remain so for the next 24 hours.
Потоки електронів на геостаціонарній орбіті
The greater than 2 MeV electron flux, as measured by GOES-19 and GOES-18 satellites, exceeded the 1000 pfu alert threshold level for most of the time during the past 24 hours, in response to the high solar wind speed associated with the SIDC Coronal Hole 116 crossing the central meridian during Jun 21-25. The electron flux is currently above the threshold level and it is expected to remain so during most of the next 24 hours. The 24h electron fluence was at moderate levels and is expected to remain so.
Розрахунок міжнародної кількості сонячних плям станом на сьогодні (ISN): 132, за даними 21 станцій.Сонячні індекси за 27 Jun 2025
| Число Вольфа, Катанія | 114 |
| Сонячний потік 10 см | 118 |
| AK Chambon La Forêt | 020 |
| AK Wingst | 024 |
| Розрахунковий індекс Ap | 023 |
| Розрахункова міжнародна кількість сонячних плям | 118 - За даними 27 станцій |
Зведення помітних подій
| День | Початок | Макс | Кінець | Розташування | Сила | OP | 10cm | Катанія/NOAA | Типи радіоімпульсів | |
|---|---|---|---|---|---|---|---|---|---|---|
| Немає | ||||||||||
Надано Центром Аналізу Даних Сонячного Впливу (SIDC)© - SIDC - Оброблено SpaceWeatherLive
Весь час у UTC
Останні новини
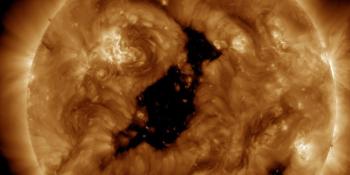
Coronal hole faces Earth

X1.5 solar flare

M2.7 solar flare, CME arrival possible
Останні повідомлення з форума
Підтримайте SpaceWeatherLive.com!
Багато людей заходять на SpaceWeatherLive, щоб стежити за сонячною активністю або якщо є можливість побачити полярне сяйво, але зі збільшенням трафіку зростають і витрати на підтримку серверів в мережі. Якщо вам подобається SpaceWeatherLive і ви хочете підтримати проект, ви можете вибрати підписку на безрекламний сайт або розглянути можливість зробити пожертву. З вашою допомогою ми зможемо підтримувати SpaceWeatherLive онлайн!


Факти про космічну погоду
| Останній X-спалах | 2026/04/24 | X2.5 |
| Останній M-спалах | 2026/05/22 | M2.3 |
| Останній геомагнітний шторм | 2026/05/16 | Kp6- (G2) |
| Дні без сонячних плям | |
|---|---|
| Останні 365 днів | 3 днів |
| 2026 | 3 днів (2%) |
| Останній день без сонячних спалахів | 2026/02/24 |
| Середня кількість сонячних плям протягом місяця | |
|---|---|
| квітня 2026 | 79.3 -6.6 |
| травня 2026 | 91.5 +12.2 |
| Останні 30 днів | 94.7 +1.9 |