Перегляд архіву вівторок, 25 листопада 2025
Щоденний бюлетень про сонячну та геомагнітну активність від SIDC
Випущено: 2025 Nov 25 1232 UTC
Прогноз SIDC
Сонячні спалахи
C-class flares expected, (probability >=50%)
Геомагнетизм
Minor storm expected (A>=30 or K=5)
Сонячні протони
Quiet
| 10 см потік | Ap | |
|---|---|---|
| 25 Nov 2025 | 118 | 038 |
| 26 Nov 2025 | 118 | 031 |
| 27 Nov 2025 | 118 | 031 |
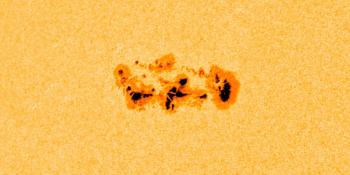
Сонячно-активні області та спалахи
Solar flaring activity was low over the past 24 hours, with few C-class flares recorded. The largest flare was a C1.5 flare (SIDC Flare 6193), peaking on November 24 at 22:03 UTC, associated with SIDC Sunspot Group 705 (NOAA Active Region 4290; magnetic type alpha). There are currently seven numbered active regions on the visible solar disk. SIDC Sunspot Group 706 (NOAA Active Region 4291; magnetic type beta-gamma) is the largest and most complex active region but remained quiet. The remaining active regions are relatively simple (magnetic type alpha or beta) and did not produce any significant flaring activity. Solar flaring activity is expected to be low over the next 24 hours, with C-class flares very likely and a chance for M-class flares.
Корональні викиди маси
No Earth-directed coronal mass ejections (CMEs) have been identified in the available coronagraph imagery over the past 24 hours.
Сонячний вітер
Over the past 24 hours, solar wind parameters (ACE and DSCOVR) reflected the influence of a high-speed stream (HSS), probably originating from a positive polarity coronal hole (SIDC Coronal Hole 128). The solar wind speed increased from 700 to 810 km/s. The interplanetary magnetic field reached values up to 13 nT before decreasing to around 7 nT. The southward component of the interplanetary magnetic field fluctuated between -10 nT and 8 nT. The magnetic field orientation was predominantly in the positive sector (field directed away from the Sun). Solar wind conditions are expected to remain slightly elevated over the next few days under the continued influence of the high-speed stream.
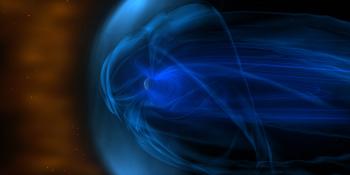
Геомагнетизм
Geomagnetic conditions reached minor storm levels (NOAA Kp = 5-, 5) between 00:00 and 03:00 UTC and betwen 06:00 and 09:00 UTC on November 25, due to the ongoing influence of a high-speed stream (HSS). Locally, minor storm conditions were observed over Belgium (K-Bel = 5) between 12:00 and 15:00 UTC on November 24. Mostly unsettled to active geomagnetic conditions are expected over the next 24 hours, with a chance of isolated minor storm periods due to the influence of the high-speed stream.
Рівні потоку протонів
Over the past 24 hours the greater than 10 MeV GOES proton flux has been at nominal levels and is expected to remain at nominal levels over the next days.
Потоки електронів на геостаціонарній орбіті
The greater than 2 MeV electron flux measured by GOES 18 and GOES 19 was below the 1000 pfu threshold. The greater than 2 MeV electron flux may exceed the 1000 pfu threshold over the next 24 hours. The 24-hour electron fluence was at normal levels and is expected to be at normal to moderate levels over the next 24 hours.
Розрахунок міжнародної кількості сонячних плям станом на сьогодні (ISN): 100, за даними 10 станцій.Сонячні індекси за 24 Nov 2025
| Число Вольфа, Катанія | 119 |
| Сонячний потік 10 см | 116 |
| AK Chambon La Forêt | 038 |
| AK Wingst | 022 |
| Розрахунковий індекс Ap | 023 |
| Розрахункова міжнародна кількість сонячних плям | 104 - За даними 17 станцій |
Зведення помітних подій
| День | Початок | Макс | Кінець | Розташування | Сила | OP | 10cm | Катанія/NOAA | Типи радіоімпульсів | |
|---|---|---|---|---|---|---|---|---|---|---|
| Немає | ||||||||||
Надано Центром Аналізу Даних Сонячного Впливу (SIDC)© - SIDC - Оброблено SpaceWeatherLive
Весь час у UTC
Останні новини
Complex sunspot region 4366
CME impact! S4 solar radiation storm

X1.9 solar flare with earth-directed CME
Останні повідомлення з форума
Більше темПідтримайте SpaceWeatherLive.com!
Багато людей заходять на SpaceWeatherLive, щоб стежити за сонячною активністю або якщо є можливість побачити полярне сяйво, але зі збільшенням трафіку зростають і витрати на підтримку серверів в мережі. Якщо вам подобається SpaceWeatherLive і ви хочете підтримати проект, ви можете вибрати підписку на безрекламний сайт або розглянути можливість зробити пожертву. З вашою допомогою ми зможемо підтримувати SpaceWeatherLive онлайн!


Факти про космічну погоду
| Останній X-спалах | 2026/02/04 | X4.3 |
| Останній M-спалах | 2026/02/05 | M1.1 |
| Останній геомагнітний шторм | 2026/02/05 | Kp5+ (G1) |
| Дні без сонячних плям | |
|---|---|
| Останній день без сонячних спалахів | 2022/06/08 |
| Середня кількість сонячних плям протягом місяця | |
|---|---|
| січня 2026 | 112.6 -11.4 |
| лютого 2026 | 139.3 +26.7 |
| Останні 30 днів | 124.9 +18 |