The Interplanetary Magnetic Field (IMF)
The interplanetary magnetic field (IMF) plays a huge rule in how the solar wind interacts with Earth’s magnetosphere. In this article we will learn what the interplanetary magnetic field is and how it affects auroral activity here on Earth.
The Sun’s magnetic field
During solar minimum, the magnetic field of the Sun looks similar to Earth’s magnetic field. It looks a bit like an ordinary bar magnet with closed lines close to the equator and open field lines near the poles. Scientist call those areas a dipole. The dipole field of the Sun is about as strong as a magnet on a refrigerator (around 50 gauss). The magnetic field of the Earth is about 100 times weaker.
Around solar maximum, when the Sun reaches her maximum activity, many sunspots are visible on the visible solar disk. These sunspots are filled with magnetism and large magnetic field lines which run material along them. These field lines are often hundreds of times stronger than the surrounding dipole. This causes the magnetic field around the Sun to be a very complex magnetic field with many disturbed field lines.
The magnetic field of our Sun doesn’t stay around the Sun itself. The solar wind carries it through the Solar System until it reaches the heliopause. The heliopause is the place where the solar wind comes to a stop and where it collides with the interstellar medium. Because the Sun turns around her axis (once in about 25 days) the interplanetary magnetic field has a spiral shape which is called the Parker Spiral.
Bt value
The Bt value of the interplanetary magnetic field indicates the total strength of the interplanetary magnetic field. It is a combined measure of the magnetic field strength in the north-south, east-west, and towards-Sun vs. away-from-Sun directions. The higher this value, the better it is for enhanced geomagnetic conditions. We speak of a moderately strong total interplanetary magnetic field when the Bt exceeds 10nT. Strong values start at 20nT and we speak of a very strong total interplanetary magnetic field when values exceed 30nT. The units are in nano-Tesla (nT) — named after Nikola Tesla, the famous physicist, engineer and inventor.
Bx, By and Bz
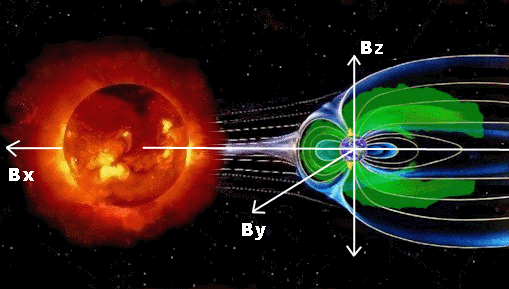
The interplanetary magnetic field is a vector quantity with a three axis component, two of which (Bx and By) are orientated parallel to the ecliptic. The Bx and By components are not important for auroral activity and are therefor not featured on our website. The third component, the Bz value is perpendicular to the ecliptic and is created by waves and other disturbances in the solar wind.

Interaction with Earth’s magnetosphere
The north-south direction of the interplanetary magnetic field (Bz) is the most important ingredient for auroral activity. When the north-south direction (Bz) of the the interplanetary magnetic field is orientated southward, it will connect with Earth’s magnetosphere which points northward. Think of the ordinary bar magnets that you have at home. Two opposite poles attract each other! A (strong) southward Bz can create havoc with Earth’s magnetic field, disrupting the magnetosphere and allowing particles to rain down into our atmosphere along Earth’s magnetic field lines. When these particles collide with the oxygen and nitrogen atoms that make up our atmosphere, it causes them to glow and emit light which we see as aurora.
For a geomagnetic storm to develop it is vital that the direction of the interplanetary magnetic field (Bz) turns southward. Continues values of -10nT and lower are good indicators that a geomagnetic storm could develop but the lower this value goes the better it is for auroral activity. Only during extreme events with high solar wind speeds it is possible for a geomagnetic storm (Kp5 or higher) to develop with a northward Bz.

Image: A schematic diagram showing the interaction between the IMF with a southward Bz and Earth’s magnetosphere.
It is important to note that we still cannot predict (accurately and consistently) the Bz(t) i.e. the strength, orientation and duration of the north-south interplanetary magnetic field component Bz of an incoming solar wind structure. We do not know what the solar wind and magnetic field characteristics are until it arrives at the Sun-Earth Lagrange Point 1 (fixed point in space between the Earth and the Sun about 1.5 million kilometers away from the Earth) where satellites measure the properties of the incoming solar wind. We are going to learn more about this in the next paragraph.
Measuring the interplanetary magnetic field
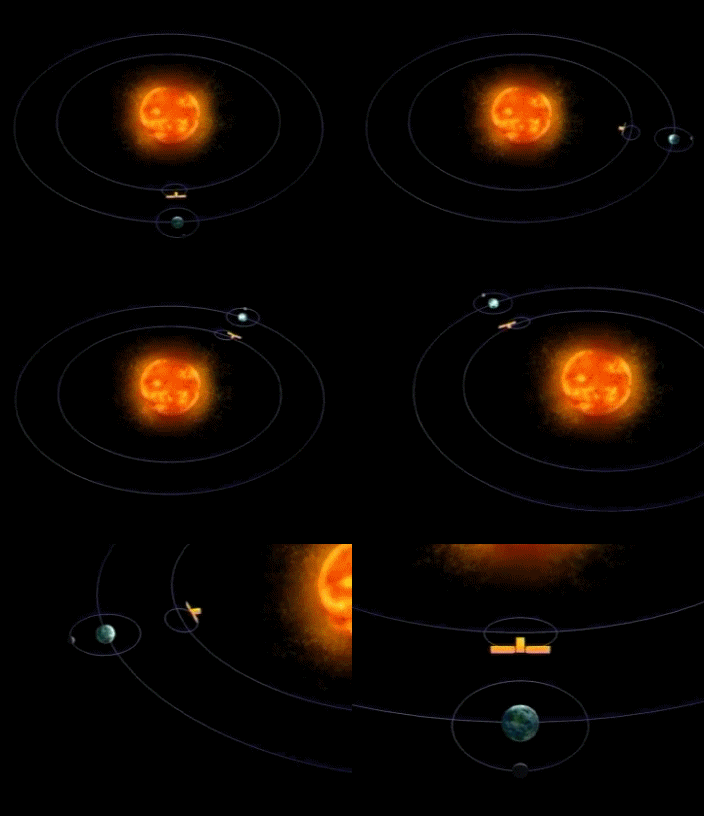
The real-time solar wind and interplanetary magnetic field data that you can find on this website come from the Deep Space Climate Observatory (DSCOVR) satellite which is stationed in an orbit around the Sun-Earth Lagrange Point 1. This is a point in space which is always located between the Sun and Earth where the gravity of the Sun and Earth have an equal pull on satellites meaning they can remain in a stable orbit around this point. This point is ideal for solar missions like DSCOVR, as this gives DSCOVR the opportunity to measure the parameters of the solar wind and the interplanetary magnetic field before it arrives at Earth. This gives us a 15 to 60 minute warning time (depending on the solar wind speed) as to what kind of solar wind structures are on their way to Earth.
The Deep Space Climate Observatory (DSCOVR) mission is now the primary source for real-time solar wind and interplanetary magnetic field data but there is one more satellite at the Sun-Earth L1 point that measures the incoming solar wind and and that is the Advanced Composition Explorer. This satellite used to be the primary real-time space weather data source up until July 2016 when DSCOVR become fully operational. The Advanced Composition Explorer (ACE) satellite is still collecting data and now operates mostly as a backup to DSCOVR.

Image: The location of a satellite at the Sun-Earth L1 point.
Latest news
Latest forum messages
Support SpaceWeatherLive.com!
A lot of people come to SpaceWeatherLive to follow the Solar activity or if there is a chance to see the aurora, but with more traffic comes higher costs to keep the servers online. If you like SpaceWeatherLive and want to support the project you can choose a subscription for an ad-free site or consider a donation. With your help we can keep SpaceWeatherLive online!
Space weather facts
| Last X-flare | 2026/02/04 | X4.21 |
| Last M-flare | 2026/02/16 | M2.4 |
| Last geomagnetic storm | 2026/02/16 | Kp6 (G2) |
| Spotless days | |
|---|---|
| Last spotless day | 2022/06/08 |
| Monthly mean Sunspot Number | |
|---|---|
| January 2026 | 112.6 -11.4 |
| February 2026 | 103.9 -8.7 |
| Last 30 days | 120.3 +12.4 |


