M1.1 solar flare, coronal hole facing Earth
Sunday, 12 April 2015 12:46 UTC

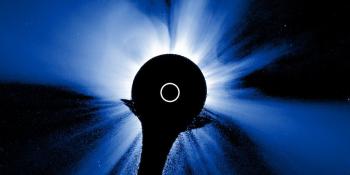
Newly numbered sunspot region 2321 looks to have fully rotated into view and was the source of an M1.1 (R1-minor) solar flare at 09:50 UTC. SOHO coronagraph imagery show that a minor coronal mass ejection was launched but it will more than likely be directed away from Earth.
Sunspot region 2321 possesses a couple of moderately large sunspots but it is surrounded by faculae, indicating this sunspot region decayed and was likely (much) bigger on the far side. We should nonetheless be alert for more moderately strong (R1) solar flares from this sunspot region.
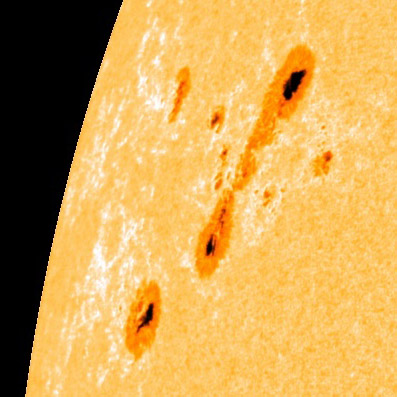
Image: Sunspot region 2321 is surrounded by faculae as can be seen on this image by SDO.
Coronal hole facing Earth
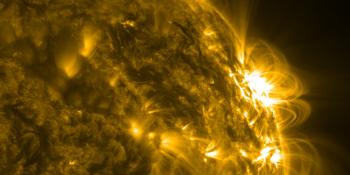
Active (Kp4) to minor geomagnetic storming conditions (Kp5) are possible on April 14 and April 15 as a coronal hole high speed solar wind stream is expected to arrive on these dates. This solar wind stream is expected to originate from a southerly coronal hole that extends to about 20 degrees south of the solar equator meaning the stream is likely to hit Earth.

Image: A coronal hole is now facing Earth as can be seen on this image from SDO in the 211 Ångström wavelength.
Thank you for reading this article! Did you have any trouble with the technical terms used in this article? Our help section is the place to be where you can find in-depth articles, a FAQ and a list with common abbreviations. Still puzzled? Just post on our forum where we will help you the best we can!
Latest news
M8.1 solar flare with earth-directed CME
X1.9 solar flare, Coronal hole faces Earth
X4.0 solar flare
Latest forum messages
Support SpaceWeatherLive.com!
A lot of people come to SpaceWeatherLive to follow the Solar activity or if there is a chance to see the aurora, but with more traffic comes higher costs to keep the servers online. If you like SpaceWeatherLive and want to support the project you can choose a subscription for an ad-free site or consider a donation. With your help we can keep SpaceWeatherLive online!


Space weather facts
| Last X-flare | 2025/12/08 | X1.1 |
| Last M-flare | 2025/12/12 | M1.1 |
| Last geomagnetic storm | 2025/12/12 | Kp5 (G1) |
| Spotless days | |
|---|---|
| Last spotless day | 2022/06/08 |
| Monthly mean Sunspot Number | |
|---|---|
| November 2025 | 91.8 -22.8 |
| December 2025 | 139.6 +47.8 |
| Last 30 days | 106.8 +8.5 |