Goodbye sunspot region 2192, website updates
Saturday, 1 November 2014 00:21 UTC

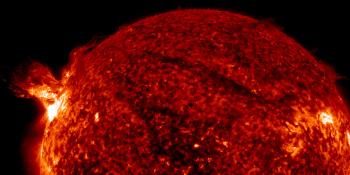
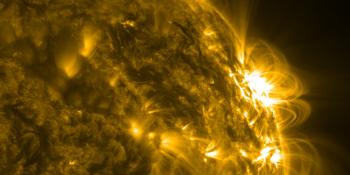
Solar activity is declining to lower levels as sunspot region 2192 has now rotated out of view and begins it's 2 week transit across the farside of the Sun. Sunspot region 2192 was the largest sunspot region in 24 years and it was exciting to follow it's development but we can conclude that it was perhaps a disappointing experience for aurora watchers around the world as sunspot region 2192 failed to launch any earth-directed coronal mass ejections. Sunspot region 2192 was nonetheless the type of sunspot region that we rarely see in any given solar cycle so of course it deserves our attention one more time. On YouTube we now have a video showing sunspot region 2192 as it evolved and the six X-class solar flares that it produced. But that's not all! We also introduced some new and exciting features today! We will tell you more about those later in this article.
Sunspot region 2192
Website update: Solar Cycle progression
We introduced a few new graphs under the Solar Cycle progression page including a graph showing the number of C, M and X-class solar flares per year and per month as well as a graph showing the number of days with a geomagnetic storm per year. These graphs give us a whole new way to see how a solar cycle is evolving over time.
New page: Top 25 sunspot regions
With large sunspot region 2192 fresh in our memory we looked for a way to quickly find information regarding the size of certain sunspot regions. This resulted in the Top 25 sunspot regions page which will give you an overviewing of the largest sunspot regions of solar cycle 23 and 24.
New page: Mauna Loa Solar Observatory
We are glad to announce that we are now also providing data and imagery provided with permission from the kind people over at the Mauna Loa Solar Observatory (see header image) in Hawaii. This is ground-based observatory which gives us exciting new imagery that we weren't able to provided before like GONG H-alpha imagery.
Other minor website improvements include detailed explanations on the real-time solar images pages. We hope you enjoy these new features!
Thank you for reading this article! Did you have any trouble with the technical terms used in this article? Our help section is the place to be where you can find in-depth articles, a FAQ and a list with common abbreviations. Still puzzled? Just post on our forum where we will help you the best we can!
Latest news

M8.1 solar flare with earth-directed CME
X1.9 solar flare, Coronal hole faces Earth
X4.0 solar flare
Latest forum messages
Support SpaceWeatherLive.com!
A lot of people come to SpaceWeatherLive to follow the Solar activity or if there is a chance to see the aurora, but with more traffic comes higher costs to keep the servers online. If you like SpaceWeatherLive and want to support the project you can choose a subscription for an ad-free site or consider a donation. With your help we can keep SpaceWeatherLive online!


Space weather facts
| Last X-flare | 2025/12/08 | X1.1 |
| Last M-flare | 2025/12/12 | M1.1 |
| Last geomagnetic storm | 2025/12/12 | Kp5 (G1) |
| Spotless days | |
|---|---|
| Last spotless day | 2022/06/08 |
| Monthly mean Sunspot Number | |
|---|---|
| November 2025 | 91.8 -22.8 |
| December 2025 | 150 +58.2 |
| Last 30 days | 108.8 +10.3 |