Viewing archive of Thursday, 10 May 2012
Solar activity report
Any mentioned solar flare in this report has a scaling factor applied by the Space Weather Prediction Center (SWPC). Because of the SWPC scaling factor, solar flares are reported as 42% smaller than for the science quality data. The scaling factor has been removed from our archived solar flare data to reflect the true physical units.
Report of Solar-Geophysical Activity 2012 May 10 2200 UTCPrepared by the NOAA © SWPC and processed by SpaceWeatherLive.com
Joint USAF/NOAA Report of Solar and Geophysical Activity
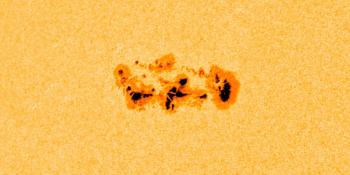
SDF Number 131 Issued at 2200Z on 10 May 2012IA. Analysis of Solar Active Regions and Activity from 09-2100Z to 10-2100Z Solar activity has been at high levels for the past 24
hours with multiple M-class solar flares observed. Region 1476
(N12E08) was responsible for almost all of the activity with 3
M-class events observed, the largest being a M5/2b event at
10/0418Z. Associated with these events, were discrete frequency
radio bursts, Tenflares, and even a Type IV radio sweep. Region 1476
has shown mixed growth and shear effects across the polarities as it
continues to evolve. A weak Earth directed CME was observed in
STEREO COR2 A and B imagery early in the period. Analysis and
current models show this CME joining the current coronal hole high
speed stream (CH HSS). Region 1477 (S22E47) was split into two
regions today as SDO magnetogram data indicated the leader and
follower sunspot groups were actually two magnetic bipoles. Leader
group is Region 1477 and follower group is now Region 1478 (S24E55).
IB. Solar Activity Forecast
Solar activity is expected to be at
moderate levels with a slight chance for X-class events for the next
three days (11 - 13 May) as Region 1476 continues to grow and
evolve.
IIA. Geophysical Activity Summary 09-2100Z to 10-2100Z
The geomagnetic field has been at quiet to active levels for the past
24 hours with an isolated minor storm period observed at high
latitudes. Solar wind measurements, as observed by the ACE
spacecraft, showed a continued increase in solar wind speeds to
around 620 km/s, a drop off in solar wind density, and the total IMF
began to stabilize around 5 nT. These characteristics are indicative
of a CH HSS. The greater than 2 MeV electron flux at geosynchronous
orbit reached high levels during the period.
IIB. Geophysical Activity Forecast
The geomagnetic field is
expected to be at quiet to unsettled levels with a chance for active
periods for the next three days (11 - 13 May). The increased
activity is due to both the continued CH HSS effects and three weak,
slow moving CMEs intertwined within.
III. Event Probabilities 11 May to 13 May
| Class M | 75% | 75% | 75% |
| Class X | 20% | 20% | 20% |
| Proton | 10% | 10% | 10% |
| PCAF | Green | ||
IV. Penticton 10.7 cm Flux
  Observed       10 May 131
  Predicted   11 May-13 May  130/130/130
  90 Day Mean        10 May 113
V. Geomagnetic A Indices
  Observed Afr/Ap 09 May  019/025
  Estimated     Afr/Ap 10 May  010/010
  Predicted    Afr/Ap 11 May-13 May  012/012-010/012-006/010
VI. Geomagnetic Activity Probabilities 11 May to 13 May
| A. Middle Latitudes | |||
|---|---|---|---|
| Active | 20% | 20% | 15% |
| Minor storm | 05% | 05% | 01% |
| Major-severe storm | 01% | 01% | 01% |
| B. High Latitudes | |||
|---|---|---|---|
| Active | 40% | 40% | 30% |
| Minor storm | 10% | 10% | 10% |
| Major-severe storm | 01% | 01% | 01% |
All times in UTC
Latest news

Tuesday, 17 March 2026
M2.7 solar flare, CME arrival possible
Sunday, 1 February 2026
Complex sunspot region 4366

Monday, 19 January 2026
CME impact! S4 solar radiation storm
Latest forum messages
AR4392 (including CMEs) 66Growth of Cycle 25 985Incoming & Unnumbered Active Regions 223Current Farside Activity 416CH 31 HSS 10
More topicsSupport SpaceWeatherLive.com!
A lot of people come to SpaceWeatherLive to follow the Solar activity or if there is a chance to see the aurora, but with more traffic comes higher costs to keep the servers online. If you like SpaceWeatherLive and want to support the project you can choose a subscription for an ad-free site or consider a donation. With your help we can keep SpaceWeatherLive online!


Space weather facts
| Last X-flare | 2026/02/04 | X4.21 |
| Last M-flare | 2026/03/17 | M1.3 |
| Last geomagnetic storm | 2026/03/14 | Kp6 (G2) |
| Spotless days | |
|---|---|
| Last 365 days | 3 days |
| 2026 | 3 days (4%) |
| Last spotless day | 2026/02/24 |
| Monthly mean Sunspot Number | |
|---|---|
| February 2026 | 78.2 -34.3 |
| March 2026 | 83.1 +4.9 |
| Last 30 days | 60 -62.3 |