Viewing archive of Thursday, 14 March 2013 - Sunspot regions
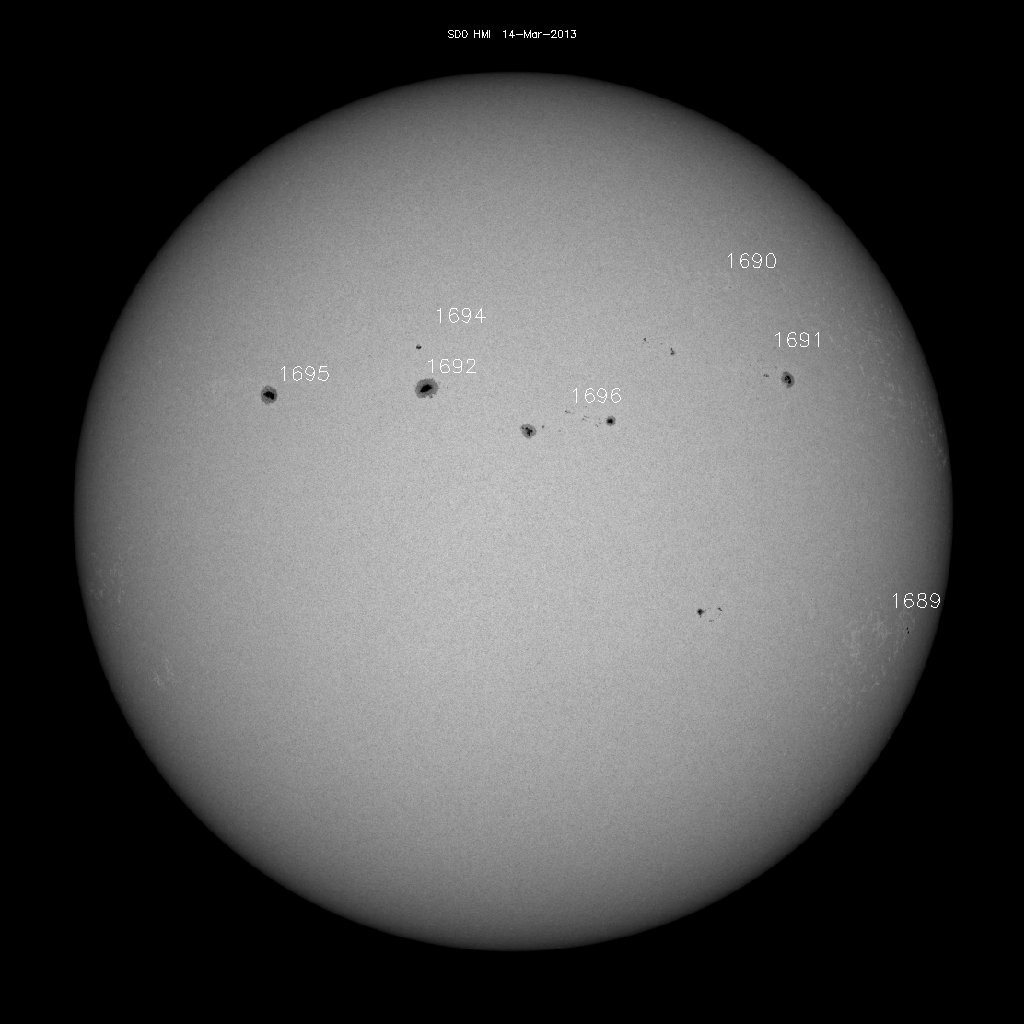
Courtesy of SDO, SOHO (NASA) and the [AIA, EVE, and/or HMI] consortium.
| Sunspot number | New regions | Background flux | Maximum flux | C |
|---|---|---|---|---|
| 133 30 | 1 1 | B3.57 | C3.08 | 1 |
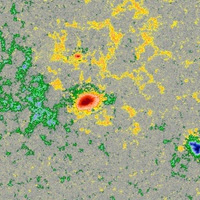
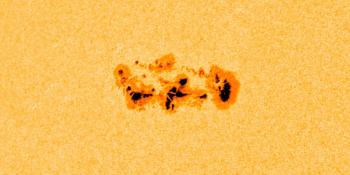
Sunspot regions
Region 11689 |
||||
|---|---|---|---|---|
| Number of sunspots |
Size | Class Magn. | Class Spot | Location |
| 4 -2 | 30 | CRO | S18W69 | |


|
||||
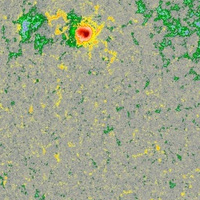
Region 11690 |
||||
|---|---|---|---|---|
| Number of sunspots |
Size | Class Magn. | Class Spot | Location |
| 2 | 10 | BXO | N25W36 | |

|
||||
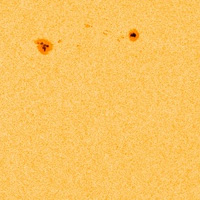
Region 11691 |
||||
|---|---|---|---|---|
| Number of sunspots |
Size | Class Magn. | Class Spot | Location |
| 8 -1 | 120 50 | DAO | N13W39 | |

|
||||
Solar flares on this day | ||||
| C3.06 B9.32 B9.51 | ||||
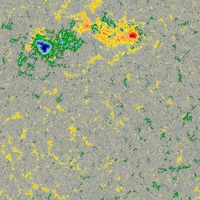
Region 11692 |
||||
|---|---|---|---|---|
| Number of sunspots |
Size | Class Magn. | Class Spot | Location |
| 2 | 200 10 | HSX | N09E09 | |

|
||||
Region 11694 |
||||
|---|---|---|---|---|
| Number of sunspots |
Size | Class Magn. | Class Spot | Location |
| 1 | 20 | HRX | N15E11 | |

|
||||
Region 11695 |
||||
|---|---|---|---|---|
| Number of sunspots |
Size | Class Magn. | Class Spot | Location |
| 1 | 160 | HSX | N09E31 | |

|
||||
Region 11696 |
||||
|---|---|---|---|---|
| Number of sunspots |
Size | Class Magn. | Class Spot | Location |
| 15 3 | 150 | EAI | N05W09 | |
|
||||
Region 11697 |
||||
|---|---|---|---|---|
| Number of sunspots |
Size | Class Magn. | Class Spot | Location |
| 4 | 30 | CRO | N15W22 | |
Region 11698 |
||||
|---|---|---|---|---|
| Number of sunspots |
Size | Class Magn. | Class Spot | Location |
| 6 | 20 | CRO | S20W29 | |
All times in UTC
Latest news

Monday, 30 March 2026
X1.5 solar flare

Tuesday, 17 March 2026
M2.7 solar flare, CME arrival possible
Sunday, 1 February 2026
Complex sunspot region 4366
Latest forum messages
Late 2026/04/01 Filament CME 71Space Weather Memes 814AR4409 120Comet C/2026 A1 (MAPS) for the southern hemisphere 38AR4403 39
More topics
Support SpaceWeatherLive.com!
A lot of people come to SpaceWeatherLive to follow the Solar activity or if there is a chance to see the aurora, but with more traffic comes higher costs to keep the servers online. If you like SpaceWeatherLive and want to support the project you can choose a subscription for an ad-free site or consider a donation. With your help we can keep SpaceWeatherLive online!


Space weather facts
| Last X-flare | 2026/03/30 | X1.5 |
| Last M-flare | 2026/04/03 | M1.3 |
| Last geomagnetic storm | 2026/04/02 | Kp6- (G2) |
| Spotless days | |
|---|---|
| Last 365 days | 3 days |
| 2026 | 3 days (3%) |
| Last spotless day | 2026/02/24 |
| Monthly mean Sunspot Number | |
|---|---|
| March 2026 | 85.9 +7.7 |
| April 2026 | 141 +55.1 |
| Last 30 days | 95.4 +31.2 |
