Viewing archive of Saturday, 4 July 2026
Daily bulletin on solar and geomagnetic activity from the SIDC
Issued: 2026 Jul 04 1231 UTC
SIDC Forecast
Solar flares
M-class flares expected (probability >=50%)
Geomagnetism
Minor storm expected (A>=30 or K=5)
Solar protons
Warning condition (activity levels expected to increase, but no numeric forecast given)
| 10cm flux | Ap | |
|---|---|---|
| 04 Jul 2026 | 187 | 022 |
| 05 Jul 2026 | 187 | 040 |
| 06 Jul 2026 | 187 | 017 |
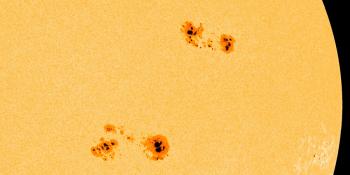
Solar Active Regions and flaring
Solar flaring activity was high over the past 24 hours, with more than M-class flares, but no X-class flares identified. The largest flare was an M6.7 flare (SIDC Flare 8104) peaking on July 03 at 18:11 UTC, produced by SIDC Sunspot Group 860 (NOAA Active Region 4479). An M6.3 flare (SIDC Flare 8109) peaking on July 03 at 18:59 UTC was produced by SIDC Sunspot Group 886 (NOAA Active Region 4478). A total of 4 numbered sunspot groups were identified on the visible solar disk over the past 24 hours. Compared with yesterday, SIDC Sunspot Group 906 (NOAA Active Region 4481) is newly emerged region on the disk, while SIDC Sunspot Group 905 had decayed. SIDC Sunspot Group 860 (NOAA Active Region 4479) was currently located at N16W70 and had a beta-gamma-delta magnetic configuration. SIDC Sunspot Group 886 (NOAA Active Region 4478) was currently located at S05W50 and had a beta-gamma magnetic configuration. SIDC Sunspot Group 901 (NOAA Active Region 4480) was currently located at S17W77 and had a beta-gamma magnetic configuration. Most of the M-class flares were produced by SIDC Sunspot Group 860, while the other M-class flares were produced by SIDC Sunspot Group 886 and SIDC Sunspot Group 901. Solar flaring activity is expected to remain high over the next 24 hours, with M-class flares very likely and a chance for X-class flares.
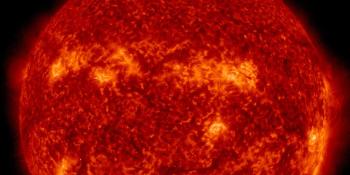
Coronal mass ejections
A partial halo Coronal Mass Ejection (SIDC CME 683) was detected by CACTUS in SOHO/LASCO C2 from around 18:12 UTC on July 03. In the plane of the sky, the CME was mainly directed towards the northwest, with a principal angle of about 291 degrees, an angular width of about 170 degrees, and a projected speed of estimated about 550 km/s. The CME is most likely associated with the M6.7 flare (SIDC Flare 8104) from SIDC Sunspot Group 860 (NOAA Active Region 4479), located near N17W62, peaking at 18:11 UTC on July 03. The eruption was accompanied by a large coronal wave and wide opening field lines, indicating an extended eruption. Due to its wide angular extent and western source location, a glancing Earth-directed component cannot be excluded in about 3 days. A second major eruption occurred shortly afterwards from SIDC Sunspot Group 886 (NOAA Active Region 4478), associated with an M6.3 flare (SIDC Flare 8109) peaking at 18:59 UTC. This second eruption was also accompanied by a coronal wave, but appears to have produced a large CME.
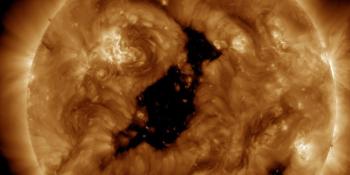
Coronal holes
The recurrent positive polarity coronal hole, SIDC Coronal Hole 159, associated with the high-latitude extension of the southern polar coronal hole, was observed in the southern hemisphere. Its extension reached the southern mid-latitudes and was first crossing the central meridian on June 30.
Solar wind
Solar wind conditions near Earth were strongly disturbed over the past 24 hours following the solar wind shock observed around 11:20 UTC on July 03. At the beginning of the period, the solar wind speed was around 450 km/s to 480 km/s. It increased from around 19:00 UTC on July 03 and remained elevated, mostly between 550 km/s and 620 km/s, reaching values up to about 637 km/s. The total interplanetary magnetic field (Bt) was already enhanced at the beginning of the period, around 10 nT to 13 nT, and increased further during the disturbed interval, reaching values up to about 24.5 nT around 00:30 UTC on July 04. Around 21:20 UTC on July 03, the interplanetary magnetic field phi angle switched from the positive to the negative sector. The Bz component fluctuated between northward and southward values during the first part of the period, then turned strongly and persistently southward from around 00:30 UTC on July 04, reaching values down to about -19 nT. The observed solar wind profile is likely related with the passage of one complex interplanetary coronal mass ejection structure associated with SIDC CME 679. Enhanced solar wind conditions may persist over the next 24 hours, with further disturbances possible from late July 04 to July 05 due to the expected arrival of the interplanetary structures associated with SIDC CME 680, SIDC CME 681, and SIDC CME 682.
Geomagnetism
Geomagnetic storm conditions were observed on July 04 in response to the prolonged southward Bz interval within the enhanced interplanetary magnetic field. NOAA Kp reached 7 during the 03:00 to 06:00 UTC interval, corresponding to major storm conditions. Locally, K BEL reached 6 during the 05:00 to 07:00 UTC interval, corresponding to moderate storm conditions. The storm response was mainly driven by the sustained negative Bz, which reached values down to about -19 nT from around 00:30 UTC on July 04. The current geomagnetic activity is likely related to the ongoing passage of the interplanetary structure associated with SIDC CME 679, first observed on June 30. Active to storm conditions may persist over the next 24 hours, depending on the evolution of Bz. Further enhanced geomagnetic conditions are possible from late July 04 to July 05 due to the expected arrival of the interplanetary structures associated with SIDC CME 680, SIDC CME 681, and SIDC CME 682.
Proton flux levels
The greater than 10 MeV proton flux, as measured by GOES, remained at background levels over the past 24 hours and is expected to remain at background levels over the next 24 hours. However, a proton flux enhancement cannot be fully excluded in case of further significant flaring activity, in particular from the complex regions currently on the visible disk, including SIDC Sunspot Groups 860 and 886 in the western hemisphere.
Electron fluxes at geostationary orbit
The greater than 2 MeV electron flux, as measured by GOES, remained below the 1000 pfu threshold over the past 24 hours and is expected to remain below the threshold over the next 24 hours. The 24h electron fluence was at normal levels and is expected to remain at normal levels over the next 24 hours.
Today's estimated international sunspot number (ISN): 097, based on 18 stations.
Solar indices for 03 Jul 2026
| Wolf number Catania | 145 |
| 10cm solar flux | 187 |
| AK Chambon La Forêt | 041 |
| AK Wingst | 012 |
| Estimated Ap | 011 |
| Estimated international sunspot number | 114 - Based on 29 stations |
Noticeable events summary
| Day | Begin | Max | End | Loc | Strength | OP | 10cm | Catania/NOAA | Radio burst types |
|---|---|---|---|---|---|---|---|---|---|
| 03 | 1303 | 1313 | 1316 | S16W64 | M1.4 | 1F | 64/4480 | ||
| 03 | 1749 | 1811 | 1832 | ---- | M6.7 | 62/4479 | V/2III/2II/2CTM/2 | ||
| 03 | 1857 | 1859 | 1903 | S07W51 | M6.3 | 2B | 63/4478 | III/2II/2 | |
| 03 | 1959 | 2008 | 2019 | S01W40 | M1.5 | SF | 63/4478 | ||
| 03 | 2350 | 0005 | ---- | M2.0 | 64/4480 | ||||
| 04 | 0013 | 0023 | 0032 | N16W71 | M2.3 | SF | 62/4479 | ||
| 04 | 0059 | 0113 | 0121 | N16W71 | M2.1 | SF | 62/4479 | ||
| 04 | 0152 | 0201 | 0208 | ---- | M1.2 | --/---- | |||
| 04 | 0321 | 0332 | 0340 | N15W76 | M3.7 | 1N | 62/4479 | VI/2 | |
| 04 | 0341 | 0342 | 0343 | N15W76 | M4.0 | 1 | 62/4479 | ||
| 04 | 0504 | 0515 | 0522 | N14W74 | M1.3 | S | 62/4479 | ||
| 04 | 0748 | 0807 | 0814 | ---- | M1.8 | 62/4479 | |||
| 04 | 0748 | 0807 | 0814 | N13W84 | M1.8 | SF | 64/4480 | ||
| 04 | 0841 | 0852 | 0856 | N14W80 | M1.0 | SF | 62/4479 | ||
| 04 | 1104 | 1112 | 1119 | ---- | M3.2 | 62/4479 |
Provided by the Solar Influences Data analysis Center© - SIDC - Processed by SpaceWeatherLive
All times in UTC
Latest news
X1.1 solar flare, G2 watch
G3 geomagnetic storm watch for 4 and 5 June
Coronal hole faces Earth
Latest forum messages
Support SpaceWeatherLive.com!
A lot of people come to SpaceWeatherLive to follow the Solar activity or if there is a chance to see the aurora, but with more traffic comes higher costs to keep the servers online. If you like SpaceWeatherLive and want to support the project you can choose a subscription for an ad-free site or consider a donation. With your help we can keep SpaceWeatherLive online!


Space weather facts
| Last X-flare | 2026/07/04 | X1.3 |
| Last M-flare | 2026/07/05 | M1.4 |
| Last geomagnetic storm | 2026/07/04 | Kp7+ (G3) |
| Spotless days | |
|---|---|
| Last 365 days | 3 days |
| 2026 | 3 days (2%) |
| Last spotless day | 2026/02/24 |
| Monthly mean Sunspot Number | |
|---|---|
| June 2026 | 94.4 -7.1 |
| July 2026 | 114 +19.6 |
| Last 30 days | 98.9 -1.6 |