Incoming CME, G3 geomagnetic storm watch
Saturday, 5 October 2024 12:09 UTC

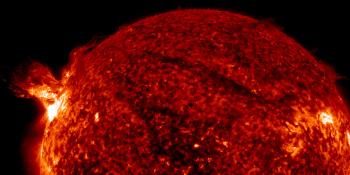
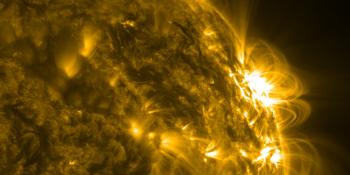
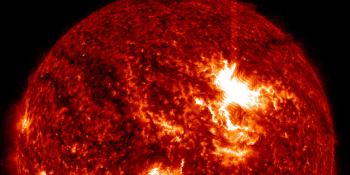
The anticipated CME from the X7 solar flare has turned out to be a nothing-burger. There was no notable impact and aurora displays were confined mostly to arctic latitudes.
However, the coronal mass ejection from the X9 solar flare which was the strongest solar flare of the current Solar Cycle thus far has of course yet to arrive. The low energy protons as measured by ACE EPAM continue to rise indicating the shock wave approaching towards our planet with an impact expected in 6 to 12 hours from now which would be today between 18 UTC and midnight UTC. A strong G3 geomagnetic storm watch remains in effect for this evening and tomorrow.

Thank you for reading this article! Did you have any trouble with the technical terms used in this article? Our help section is the place to be where you can find in-depth articles, a FAQ and a list with common abbreviations. Still puzzled? Just post on our forum where we will help you the best we can!
Latest news
Latest forum messages
Support SpaceWeatherLive.com!
A lot of people come to SpaceWeatherLive to follow the Solar activity or if there is a chance to see the aurora, but with more traffic comes higher costs to keep the servers online. If you like SpaceWeatherLive and want to support the project you can choose a subscription for an ad-free site or consider a donation. With your help we can keep SpaceWeatherLive online!
Space weather facts
| Last X-flare | 2025/12/01 | X1.9 |
| Last M-flare | 2025/12/04 | M6.0 |
| Last geomagnetic storm | 2025/12/04 | Kp5 (G1) |
| Spotless days | |
|---|---|
| Last spotless day | 2022/06/08 |
| Monthly mean Sunspot Number | |
|---|---|
| November 2025 | 91.8 -22.8 |
| December 2025 | 186 +94.2 |
| Last 30 days | 106.3 +12.6 |


