Viewing archive of Saturday, 11 October 2025
Daily bulletin on solar and geomagnetic activity from the SIDC
Issued: 2025 Oct 11 1231 UTC
SIDC Forecast
Solar flares
C-class flares expected, (probability >=50%)
Geomagnetism
Active conditions expected (A>=20 or K=4)
Solar protons
Quiet
| 10cm flux | Ap | |
|---|---|---|
| 11 Oct 2025 | 122 | 017 |
| 12 Oct 2025 | 126 | 012 |
| 13 Oct 2025 | 128 | 006 |
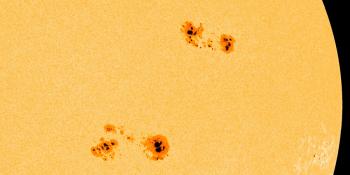
Solar Active Regions and flaring
Solar flaring activity was low over the past 24 hours, with six C1 flares identified. The most flaring solar region was SIDC sunspot group 639 (NOAA Active Region [AR] 4246, Beta magnetic configuration) with four C1 flares. SIDC Sunspot Group 621 (NOAA AR 4248, Beta-Gamma magnetic configuration) and SIDC Sunspot Group 664 (NOAA Active Region 4245, Beta magnetic configuration) produced one C1 flare each. More C-class flaring is expected in the next 24 hours, mostly from SIDC sunspot groups 621 and 639.
Coronal mass ejections
No Earth-directed Coronal Mass Ejections (CME) were observed in the last 24 hours.
Solar wind
The Solar Wind (SW) conditions are affected by a glancing blow from SIDC Coronal Mass Ejection (CME) 578 that arrived on the early hours of 11 Oct. The arrival caused the SW speed to increase from 340 to 460 km/s, while the interplanetary magnetic field (B) reached 15 nT, and its North-South component (Bz) fluctuated between -9 and 10 nT. The effect of the glancing blow is expected to last for approximately a day.
Geomagnetism
The global geomagnetic conditions reached the minor storm level (NOAA Kp 5-) on 11 Oct between 06:00 and 09:00 UTC. This is the result of the arrival of a glancing blow from SIDC Coronal Mass Ejection (CME) 578 at the early hours of 11 Oct. The local conditions followed a similar pattern, although they only reached active levels at the time of the global minor storm. For the next 24 hours both the global and local conditions are expected to wane and reach up to active levels.
Proton flux levels
The greater than 10 MeV proton flux, as measured by the GOES-19 satellite, was at background levels over the past 24 hours and is likely to remain so in the next 24 hours.
Electron fluxes at geostationary orbit
The greater than 2 MeV electron flux as measured by GOES 19 was above the 1000 pfu alert threshold on 10 Oct between 12:00 and 21:20 UTC, with a peak value at 2300 pfu. In increased again above the alert threshold for a brief period on 11 Oct between 04:45 and 06:00 UTC. For the rest of the past 24 hours the flux was below but close to the alert threshold. In the next 24 hours it is expected to repeat a similar pattern. The 24-hour electron fluence was at moderate levels during the past 24 hours. It is expected to marginally drop and remain at moderate levels in the next 24 hours.
Today's estimated international sunspot number (ISN): 106, based on 08 stations.Solar indices for 10 Oct 2025
| Wolf number Catania | 087 |
| 10cm solar flux | 121 |
| AK Chambon La Forêt | 015 |
| AK Wingst | 010 |
| Estimated Ap | 011 |
| Estimated international sunspot number | 077 - Based on 22 stations |
Noticeable events summary
| Day | Begin | Max | End | Loc | Strength | OP | 10cm | Catania/NOAA | Radio burst types | |
|---|---|---|---|---|---|---|---|---|---|---|
| None | ||||||||||
Provided by the Solar Influences Data analysis Center© - SIDC - Processed by SpaceWeatherLive
All times in UTC
Latest news
X1.1 solar flare, G2 watch
G3 geomagnetic storm watch for 4 and 5 June
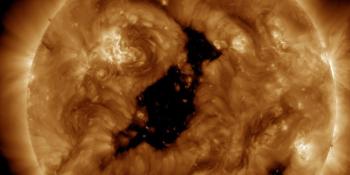
Coronal hole faces Earth
Latest forum messages
Support SpaceWeatherLive.com!
A lot of people come to SpaceWeatherLive to follow the Solar activity or if there is a chance to see the aurora, but with more traffic comes higher costs to keep the servers online. If you like SpaceWeatherLive and want to support the project you can choose a subscription for an ad-free site or consider a donation. With your help we can keep SpaceWeatherLive online!


Space weather facts
| Last X-flare | 2026/07/04 | X1.3 |
| Last M-flare | 2026/07/12 | M1.19 |
| Last geomagnetic storm | 2026/07/04 | Kp7+ (G3) |
| Spotless days | |
|---|---|
| Last 365 days | 3 days |
| 2026 | 3 days (2%) |
| Last spotless day | 2026/02/24 |
| Monthly mean Sunspot Number | |
|---|---|
| June 2026 | 94.4 -7.1 |
| July 2026 | 74.8 -19.6 |
| Last 30 days | 87 -20.2 |